October 10, 2023
Summary
Hope springs eternal
Yield curves dynamic
Fear the unknown unknown
Debt services on the rise
The mighty bond market
Liquidity, only CTAs experienced stress
Price and earnings breadth remain weak
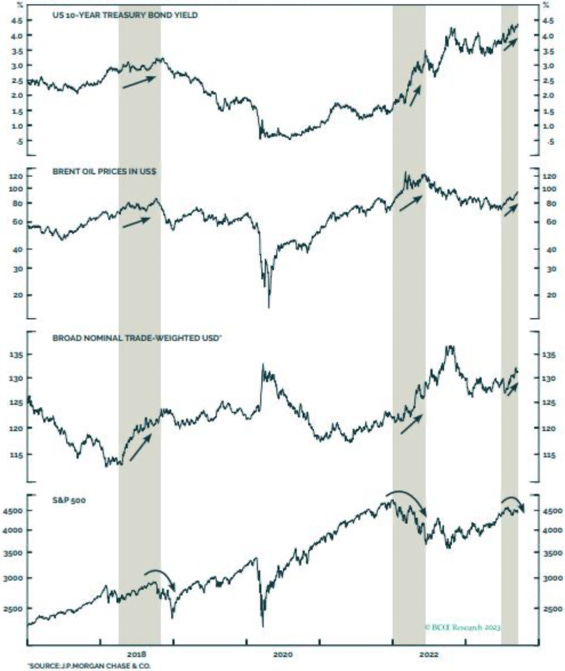
Intermarket movements do not bode well for equities
Macro – Hope
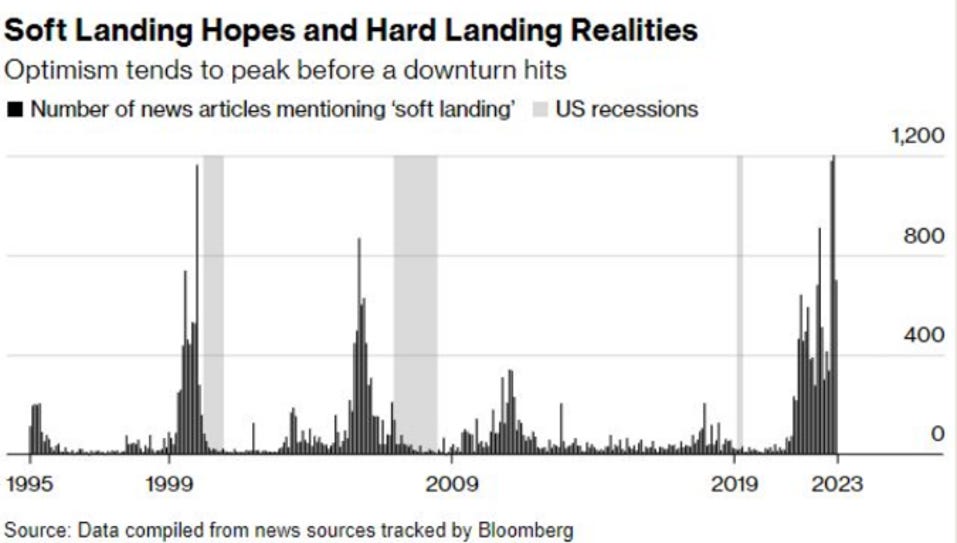
A recurring theme, and another way to show it with history going back to the mid 90’s…. the title of the graphs says it all!
Macro – Yield Curves
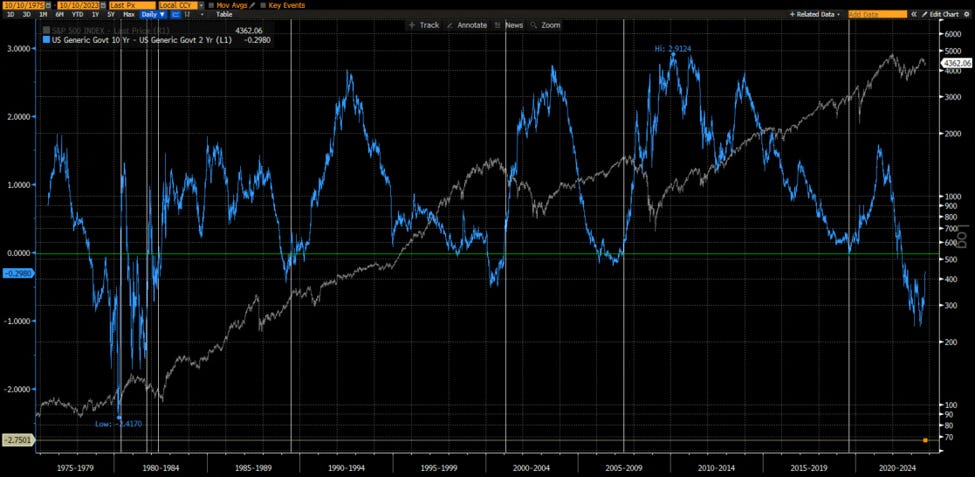
As feared, the yield curve has started a bear steepening phase which is expected to make the inversion which started more than a year ago, history. It is when the yield curve start this dis-inversion process that equities bull or bear market rallies die.
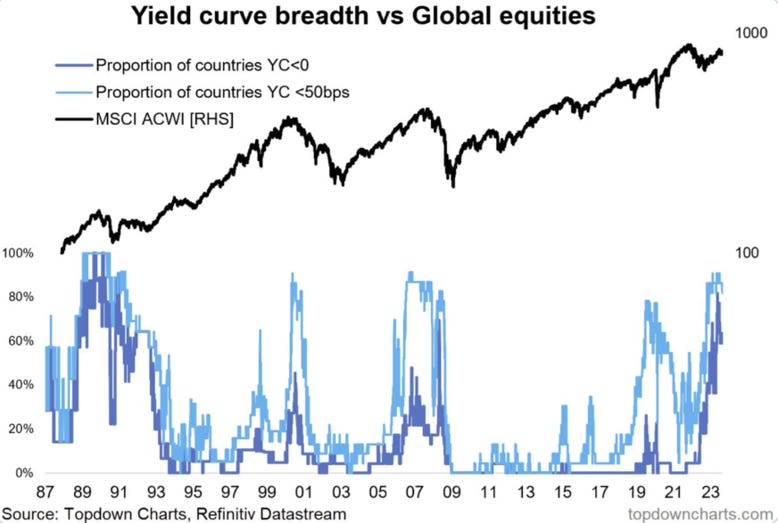
The US will not be the only one in this situation…
Macro – Households - Employment
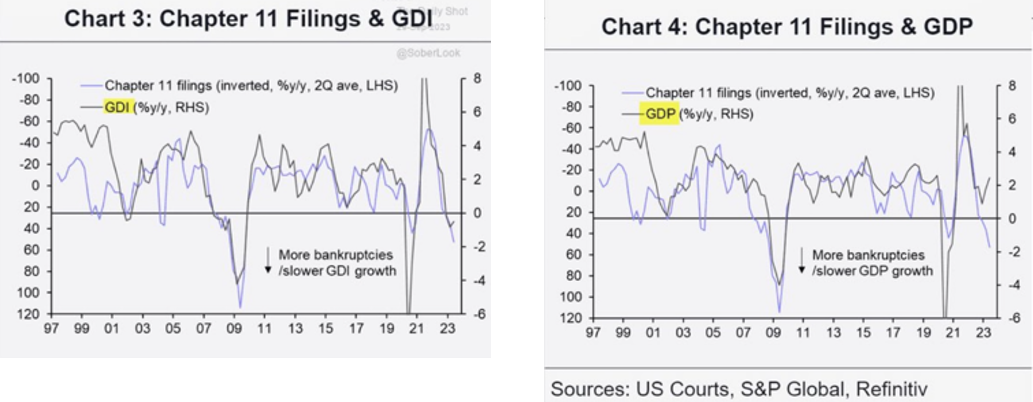
We discussed the divergence between GDP and GDI recently and why they have been the harbinger of recessions in the past. Chapter 11 fillings are not diverging with GDI…
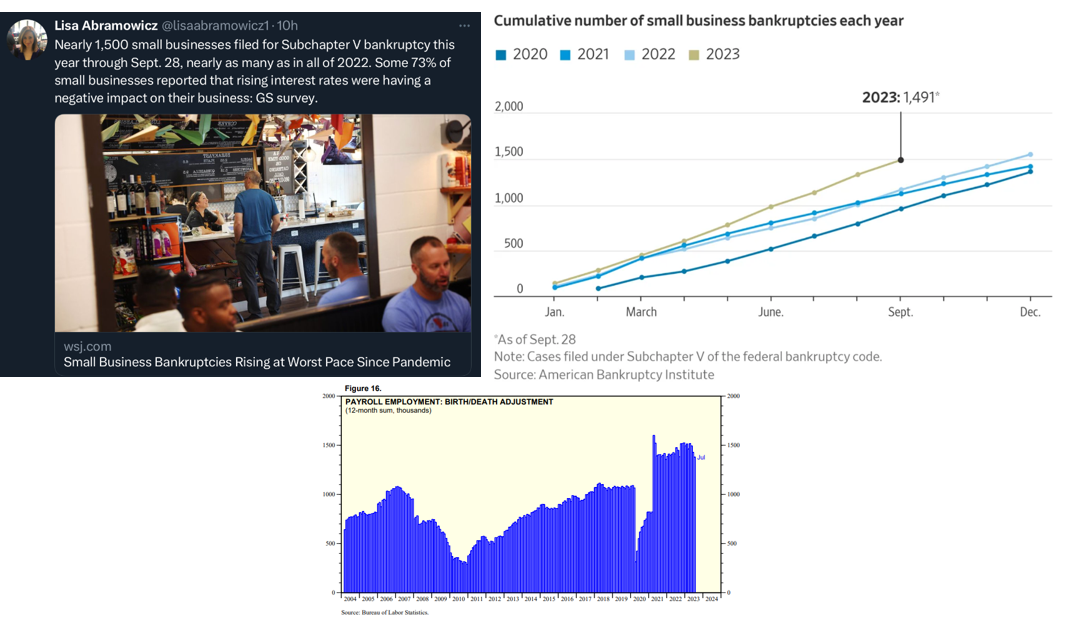
And small businesses are suffering too. It has been our contention that, as low-income households, they would be the first to feel the blunt effects of the Fed tightening policy. Don’t forget that the BLS Birth-Death adjustment (which try to estimate the contribution of (very)small business to employment) which represents a large share of the past 6-month employment growth, is most likely to be revised dramatically down in the future.
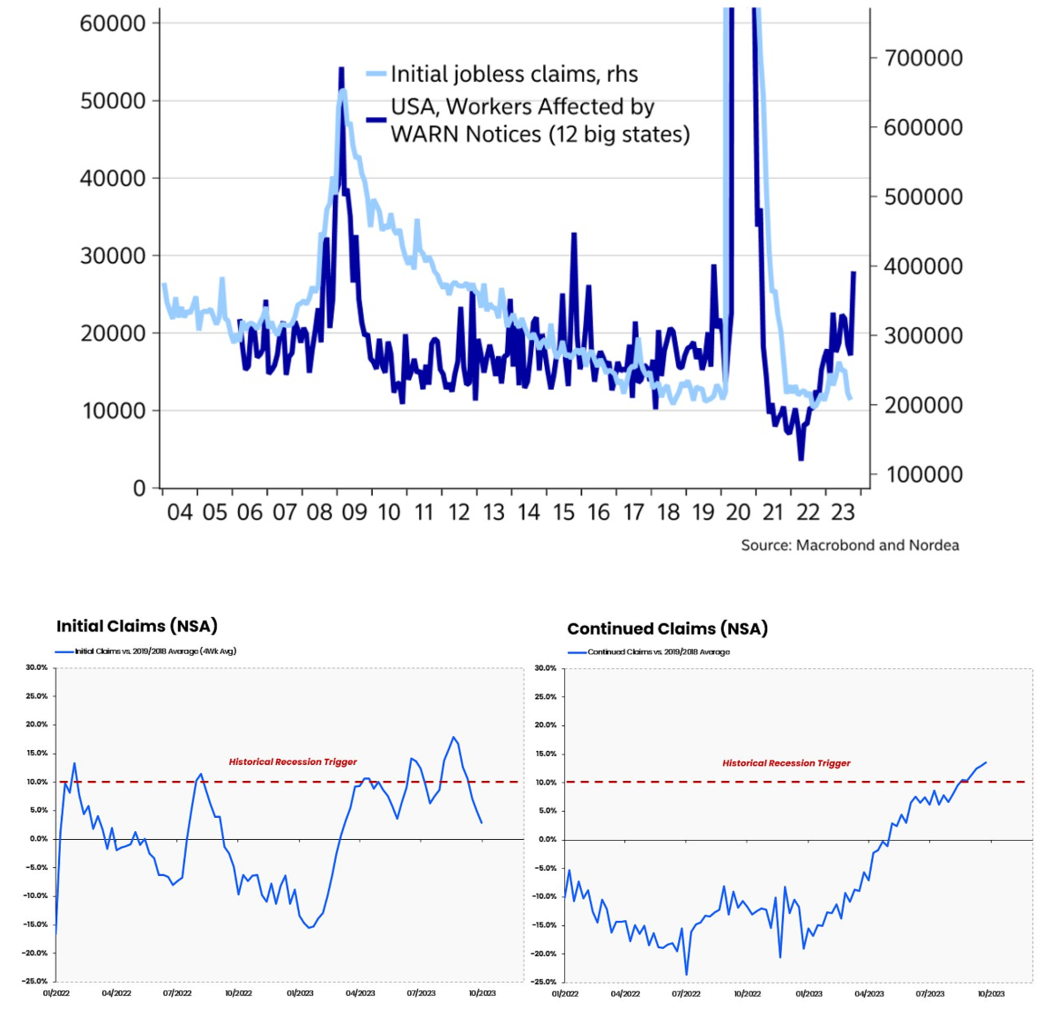
There are other cracks appearing in the job market confirming the plethora of employment leading indicators we have presented in the past
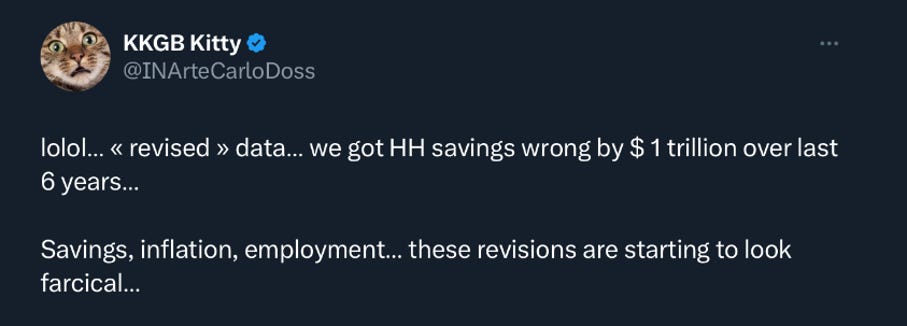
Macro – Households - Savings
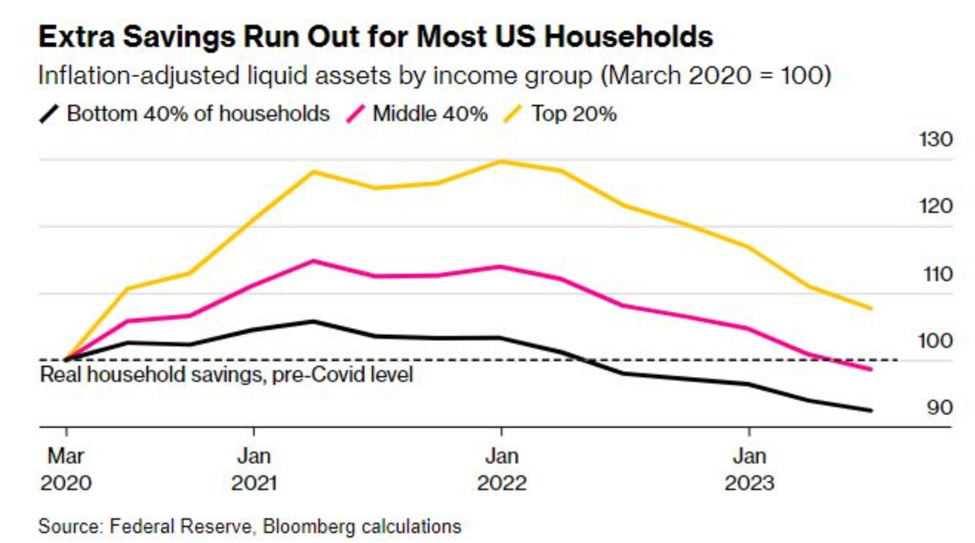
And remember that employment is the only thing keeping households afloat, hence our current obsession with it, excess savings are gone for most…
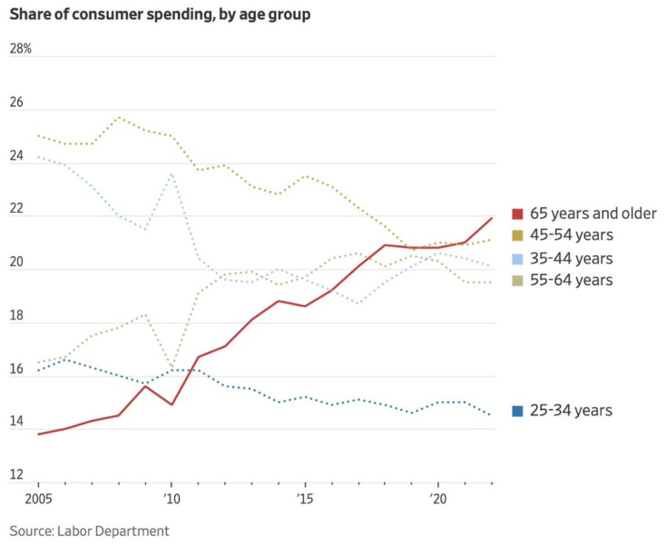
… and guess which cohort is in the top 20%
Macro – Households – Debt Burden
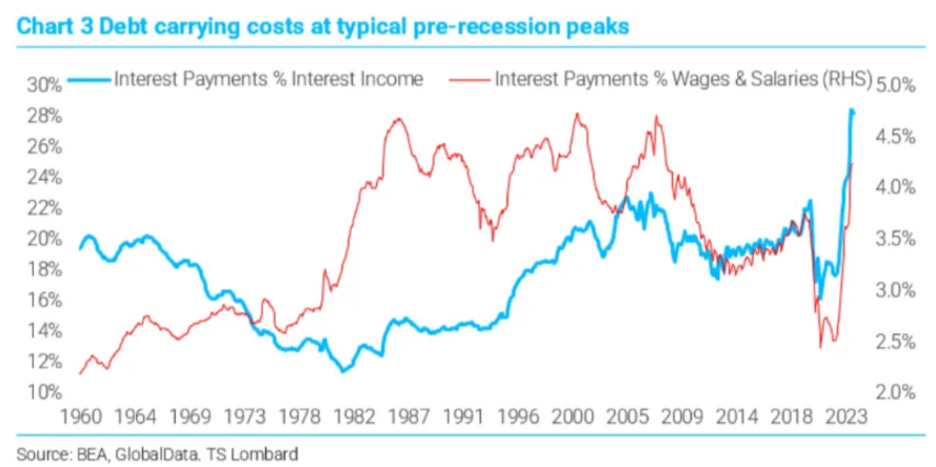
Households' debt carrying costs have risen to level which may be sufficient to induce a recession…
Macro – Corporations – Debt Burden
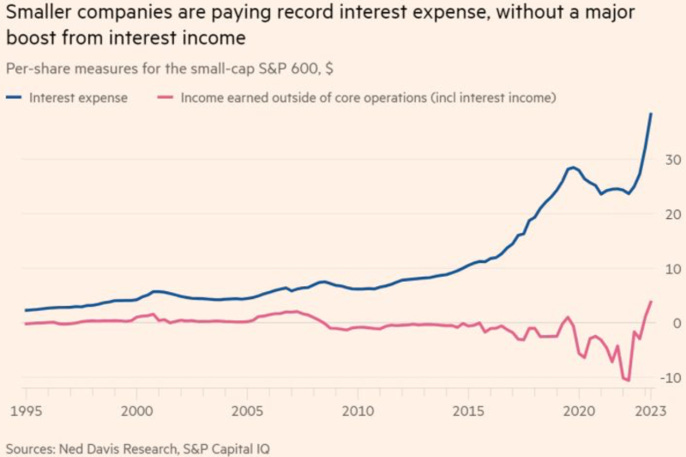
… while in the corporate sectors, the usual cash-rich suspects have profited from rising interest rates (and will only suffer when a weakening economy hits their bottom lines), smaller companies are suffering…
Macro – Corporates - Debt Burden
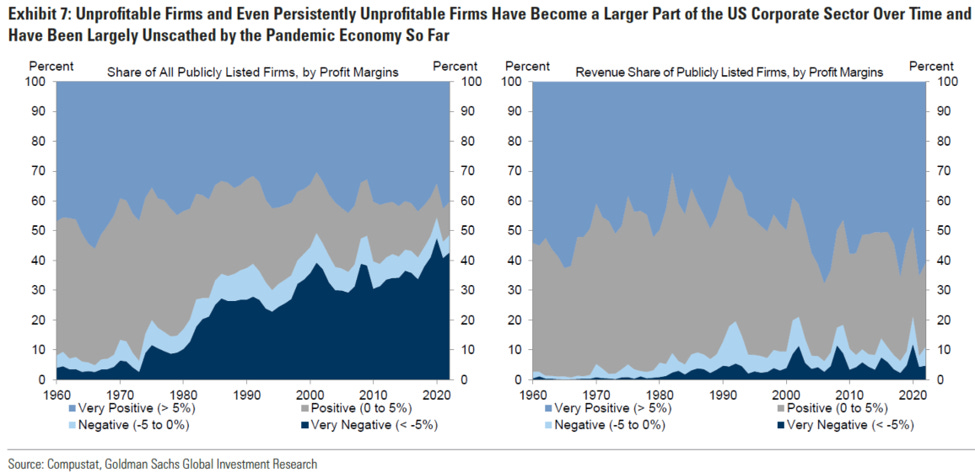
This is, we believe, the consequence of the “winner takes it all”, antiquate anti-trusts regulations plaguing the US today.
On this subject, we highly recommend Thomas Philippon “The Great Reversal”!
Let’s also not forget managements’ tendency to try to hide problems as long as possible……Michael Green had the following interaction with a reader recently…
Macro – Housing
Before we move to the elephant in the room i.e. the bond market, let’s discuss a couple of graphs on the housing market on which we have argued there are many things investors and ourselves, don’t know that they don’t know!
Do you remember our graphs on Airbnb's potentially flooding the market and on hidden inventories?
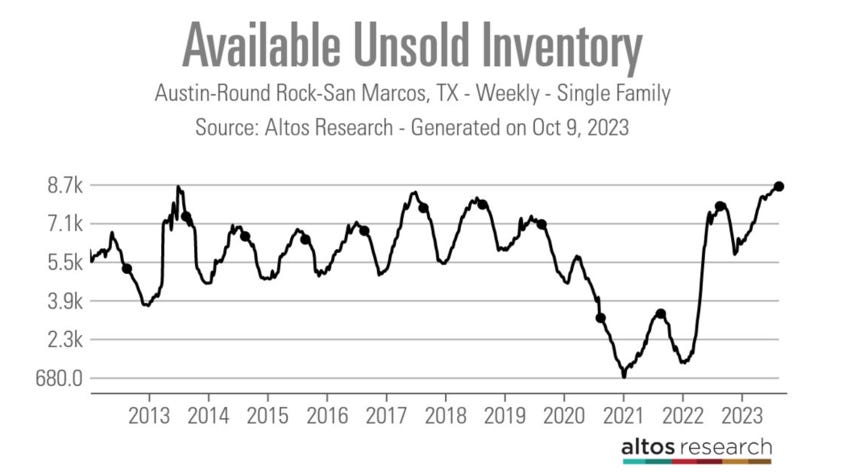
Is Austin a Canary in the Coalmine?
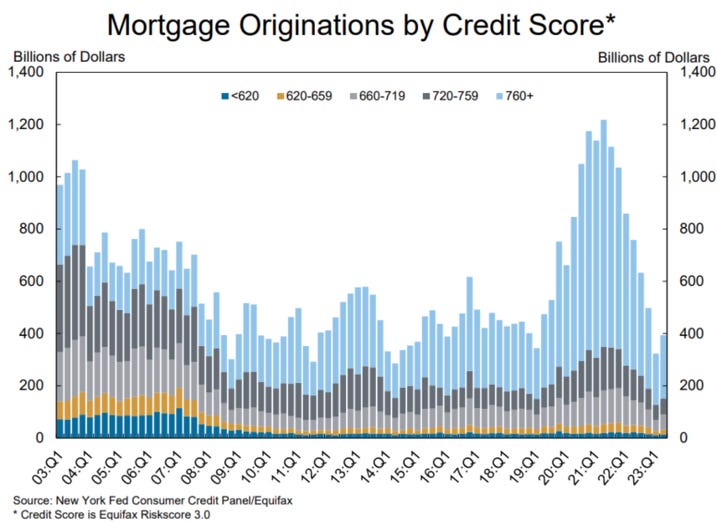
On the credit scores of mortgage borrowers, we would be interested to understand how all the various debt repayment moratorium have impacted these in the mid 2020 to early 2022 period.
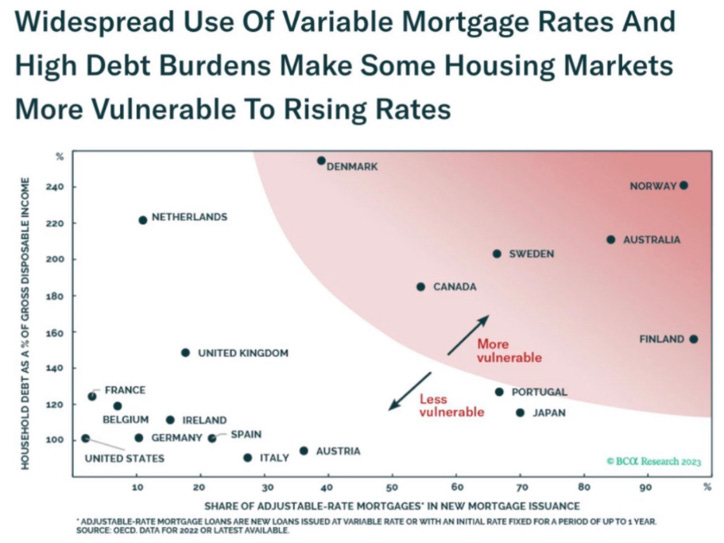
And once again while we are less sanguine on the US housing market than the majority, it still looks great compared to some other countries… Serious bank crisis and recession in the making for some…
Markets – Bonds
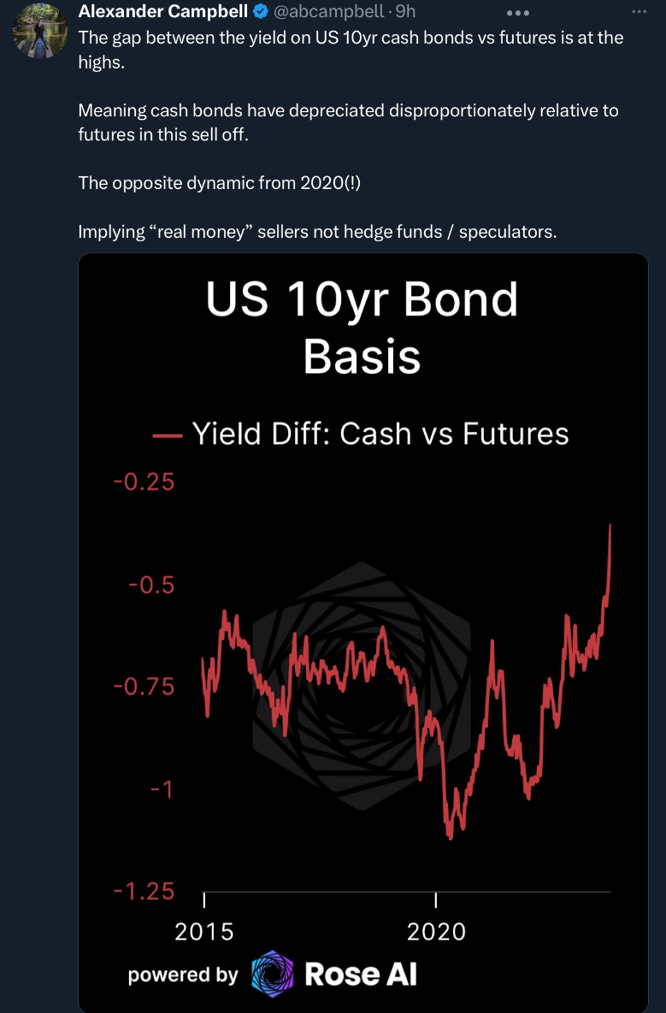
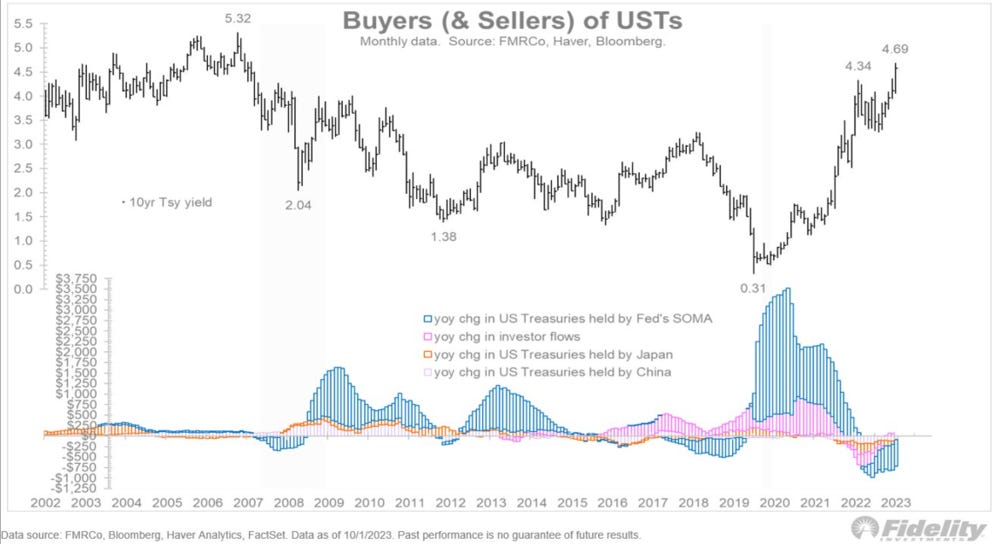
This section will spend some time on the bond demand dynamic, as what is happening has nothing to do with what happened in 2020.
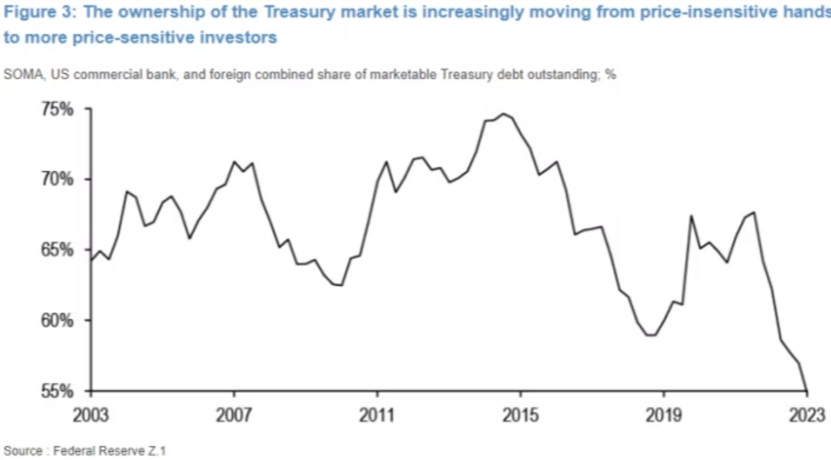
The composition of the demand is changing in a way which makes a return of the bond vigilantes era more likely, at least until the next time the Fed comes to the rescue (but as said while we are convinced it will, the bar to do so is probably much higher than before and as such “Fed Puts afficionados” are likely to experience a nasty wake up call).
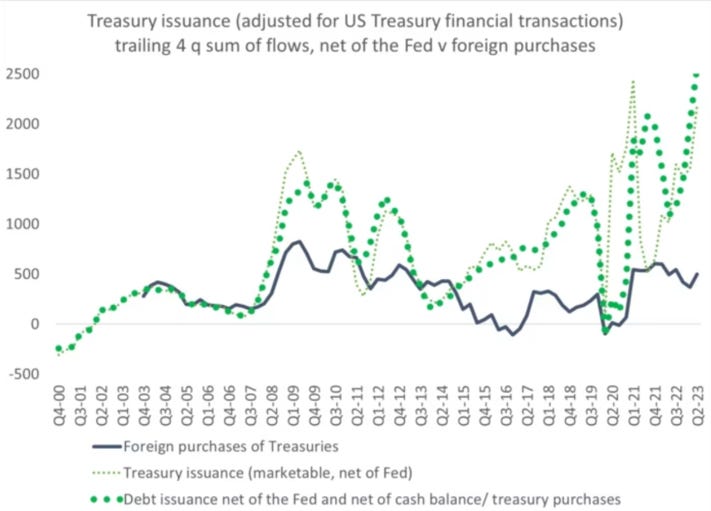
Price sensitive investors are rapidly increasing their relative ownership of the Treasury market.
All of this as issuance is going through the roof…
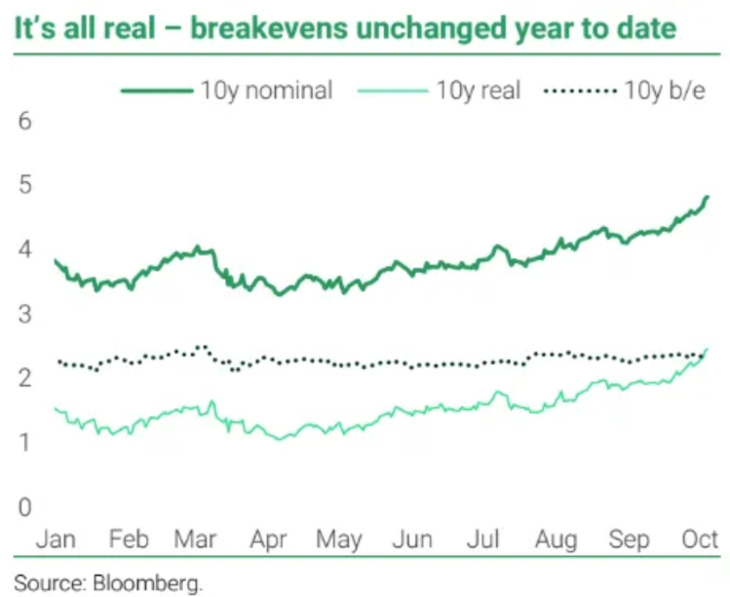
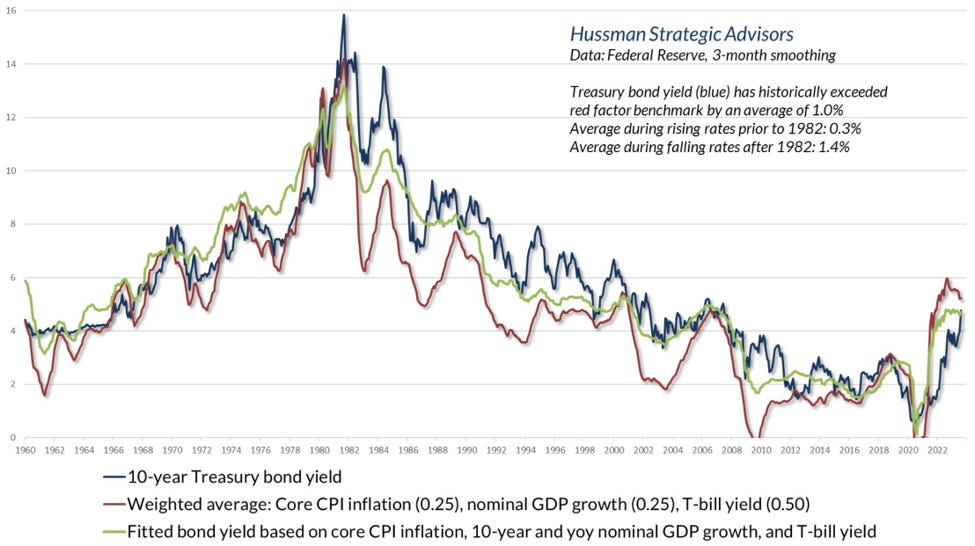
It explains that the rise has been a rise in real yields, as breakeven remained unchanged
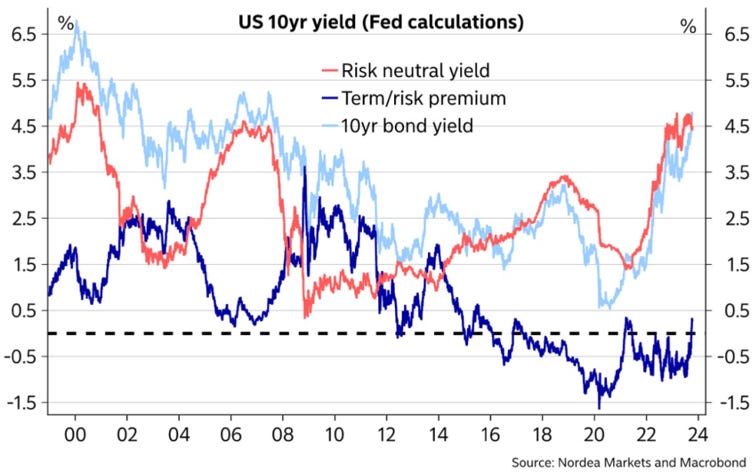
As such, the rise in real yield was principally due to the increase in the term/risk premium
On an investment side, yields have now reached what we would consider an interesting buying level (note that we usually prefer to buy a leveraged 2 years position with a 10 years Treasuries DV01).
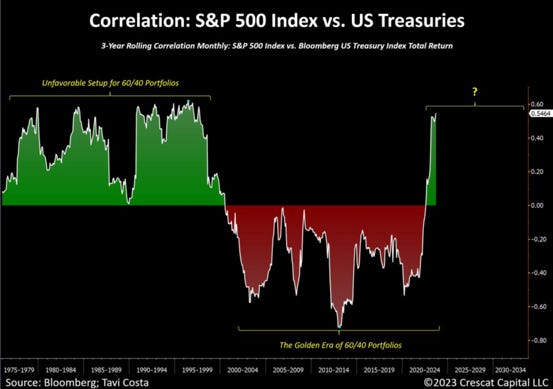
There are plenty of graphs touting the now positive correlation between bond and equity prices which back this.
While the correlation is likely to remain positive, if, as expected, governments choose the inflation path to erode the real value of their debt and the debt of the people who will put them in power (yes asset rich baby boomers won’t be able to decide elections anymore), we suspect that the correlation will turn highly negative in the short to medium term when the equity bear market reasserts itself!
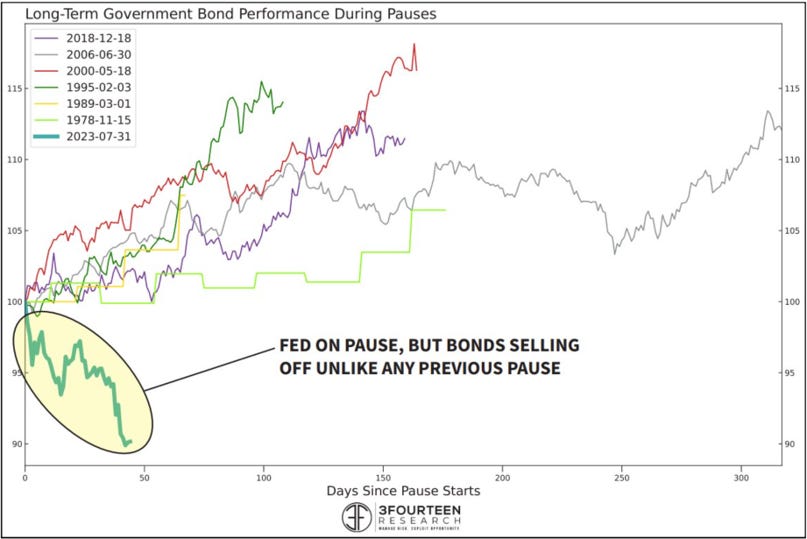
And to finish this section a nice graph from 2Fourteen Research…
Market – Liquidity
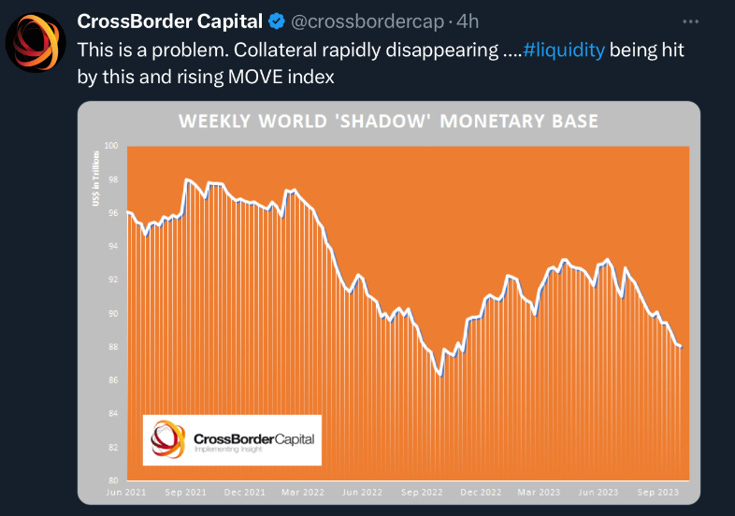
This CrossBorder Capital graph shows that the “Shadow” monetary base is declining rapidly. This does not bode well for risky assets…
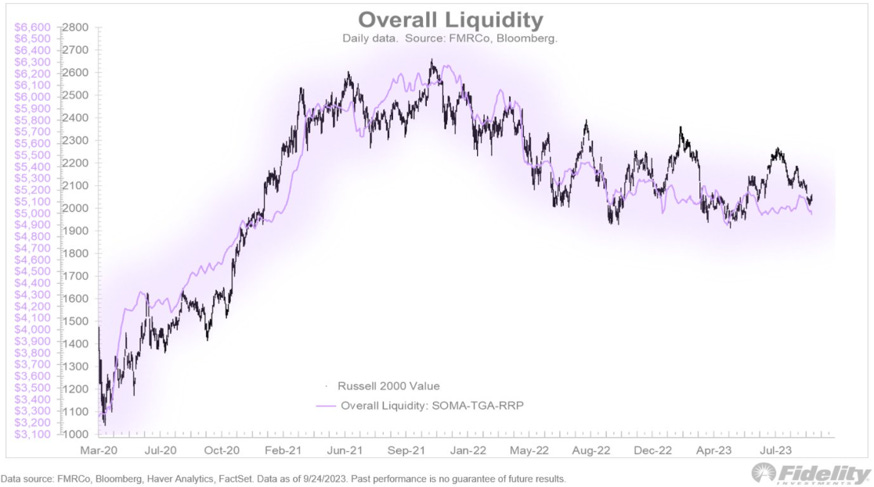
The same is true for US specific liquidity where the decline in RRP and issuance of Bills by the Treasury have delayed the reckoning. No coincidence that bond yields started their recent rapid ascent and risky assets their correction almost to the day when the Treasury announced that it would increase its longer-maturity issuance in the coming months.
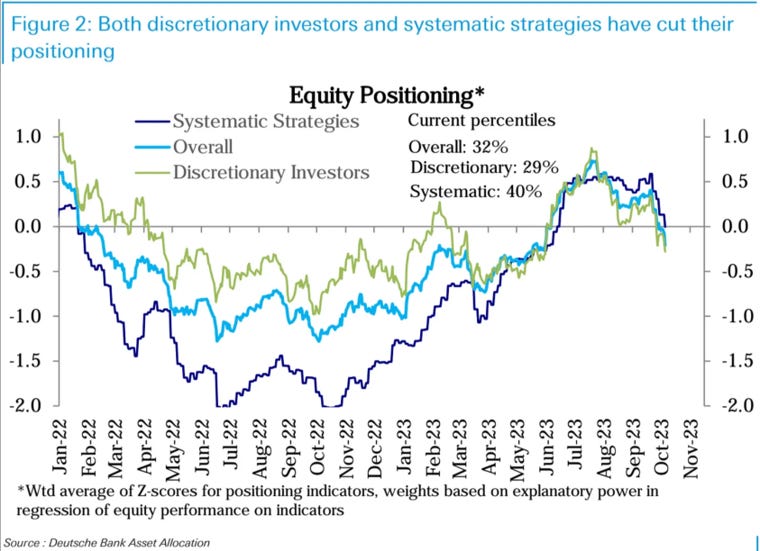
Both systematic (read value agnostic) strategies and discretionary investors have decreased their allocation in the past few weeks.
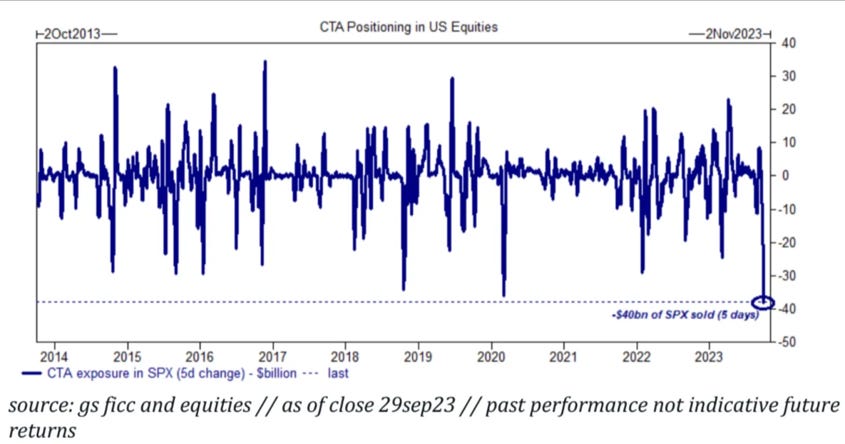
Most of the systematic strategies selling was due to CTAs. Indeed, volatility did not rise enough for volatility target funds to be heavy sellers. The large increase in fixed income volatility also reduced the need of risk parity funds to shed equities.
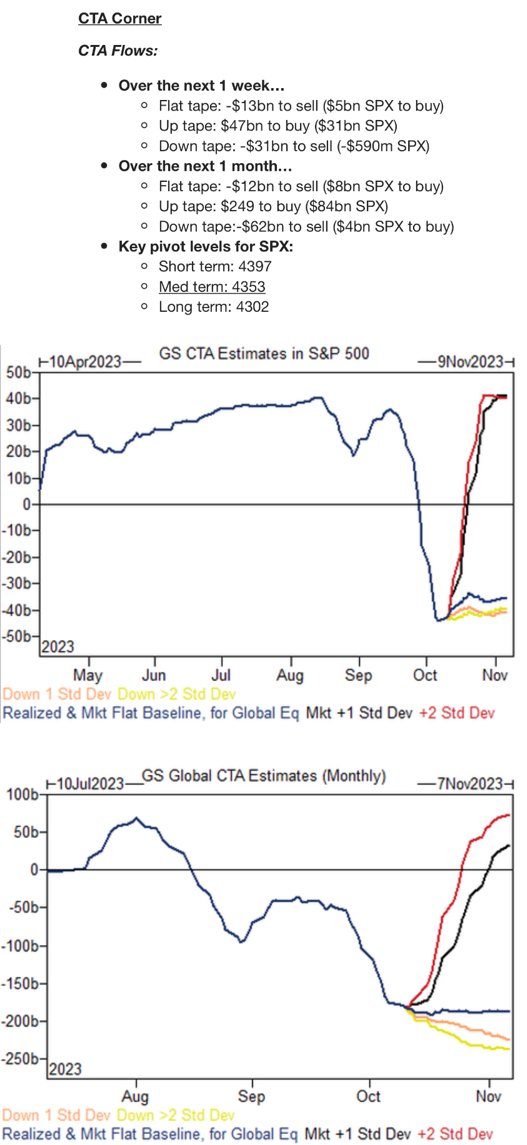
CTAs selling was so large that, for the US markets, they will be buyer over the next month, even on a declining market. We’d like to know how they get to this conclusion but... we carry the news…
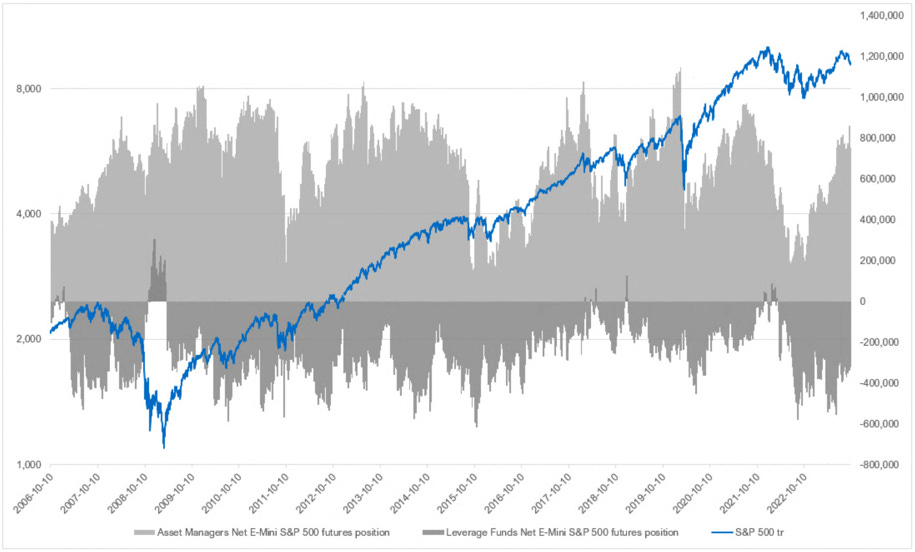
Nevertheless, asset managers remain very long (which, in itself, is not a problem in a bull market) and leveraged funds have covered half of the short positions they had last October.
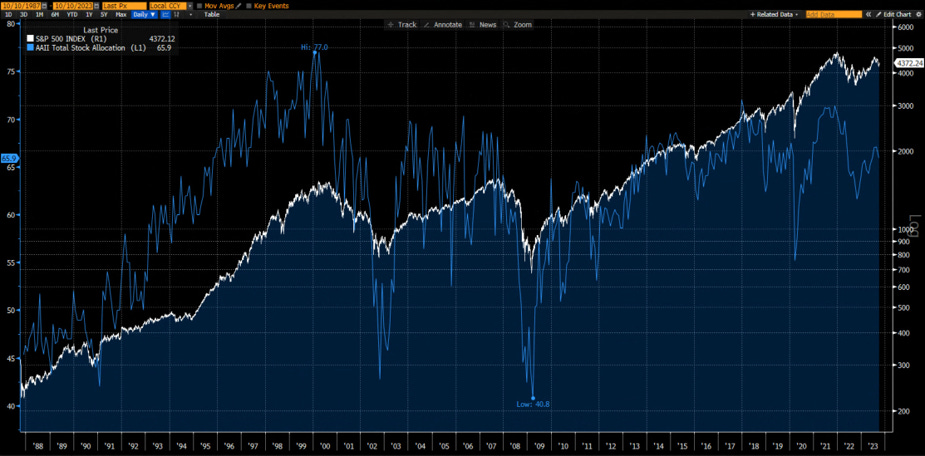
At the same time total stock allocation by individual investors surveyed by the AAII remains high in the context of an ongoing bear market
Market – Intermarket
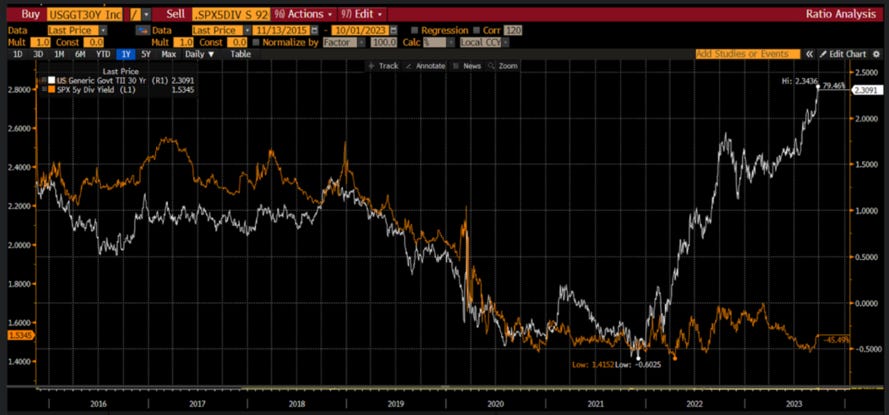
Dividend yield should be much higher (valuation lower) given where real long-term yield are…
…while bond yields, oil and the USD are not going in the right direction for equities.
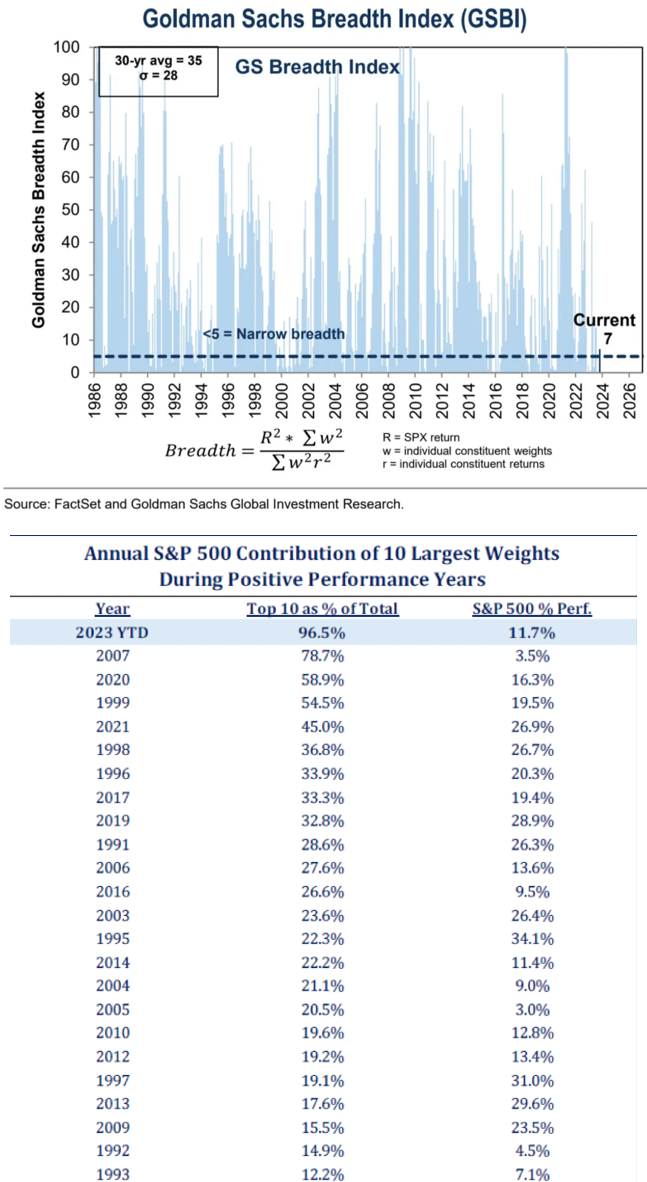
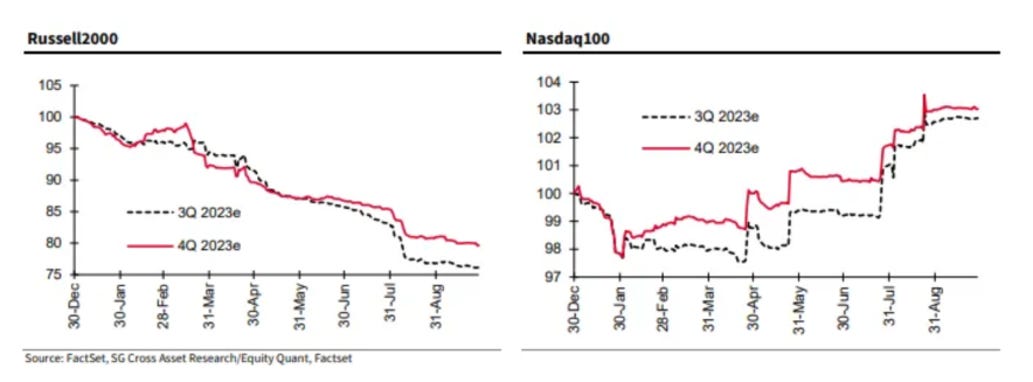
Market – Breadth
No comments needed…
Same for earning revision breadth…
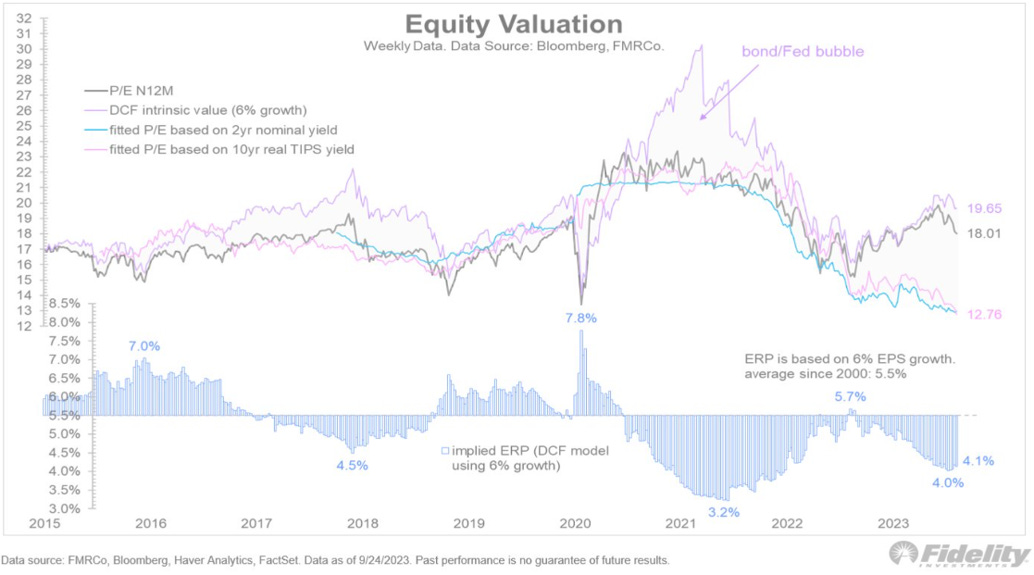
Market – Valuation
Investors are not compensated for the risk they take…
Others
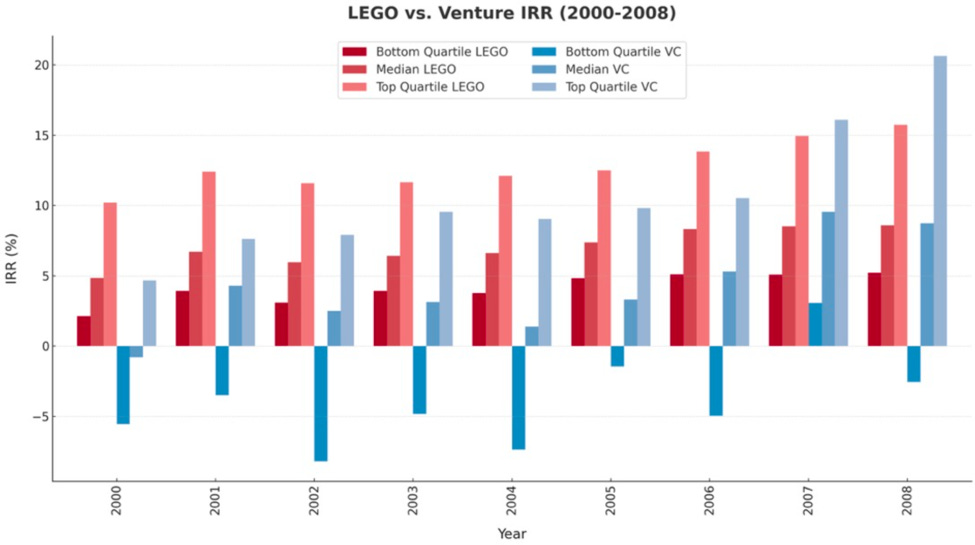
Sometimes investors overcomplicate things… and now you understand why we build all our strategies like a combination of Lego pieces (Duplo even as each piece is so simple).
Remember this when economists try to forecast any macro data more than a month forward… and try not laughing!
So sad…


