Summary
Divergences, again
Lots on Lags
Households and Corporations – tailwinds turning to headwinds
Diverging sentiment
Those mighty valuation agnostic flows
Breadth is not good
Commodities underinvestment and lack of future engineers
Macro – Divergences
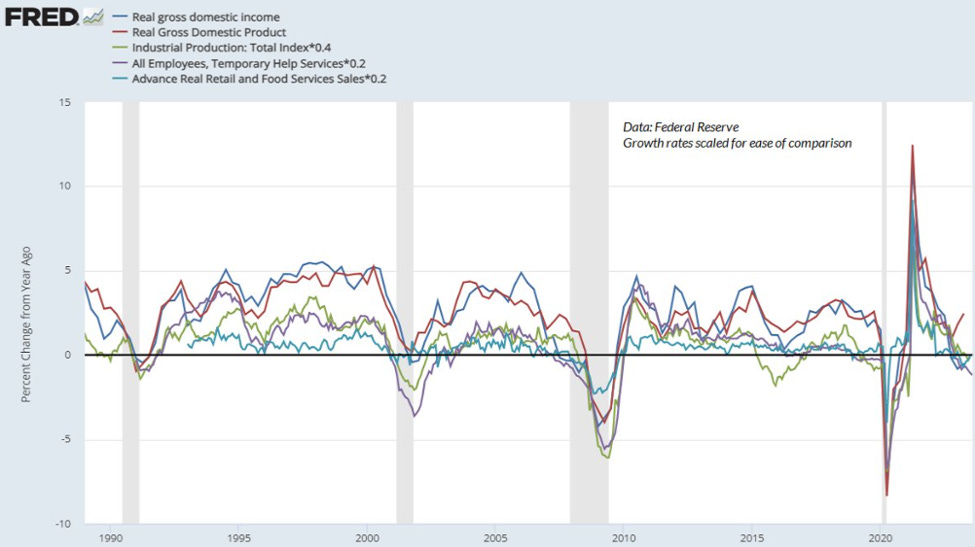
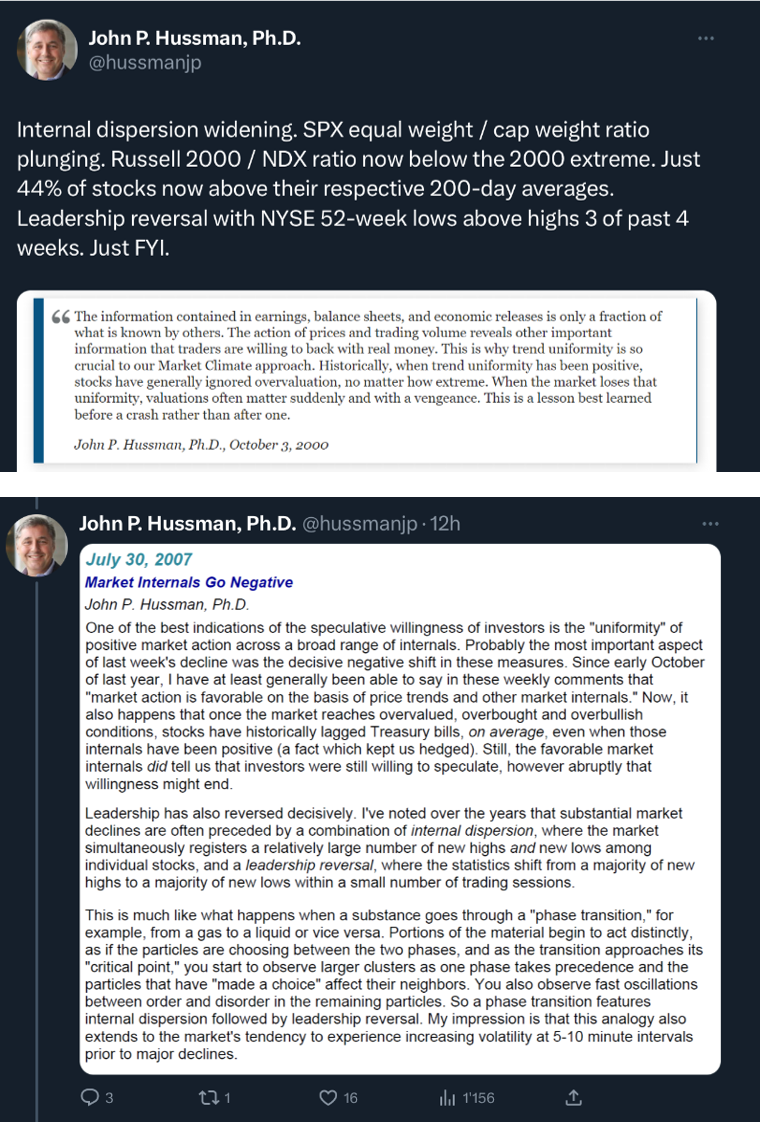
The second week in a row that we start with a chart from the excellent J. Hussman. He has critics but we are a huge fan.
GDP - As we will see later in this week MashUp, in his analysis he likes to see uniformity. If we add ECRI’s persistence concept, this chart would tell you that a recession has already started or will soon do…
Macro – Lags
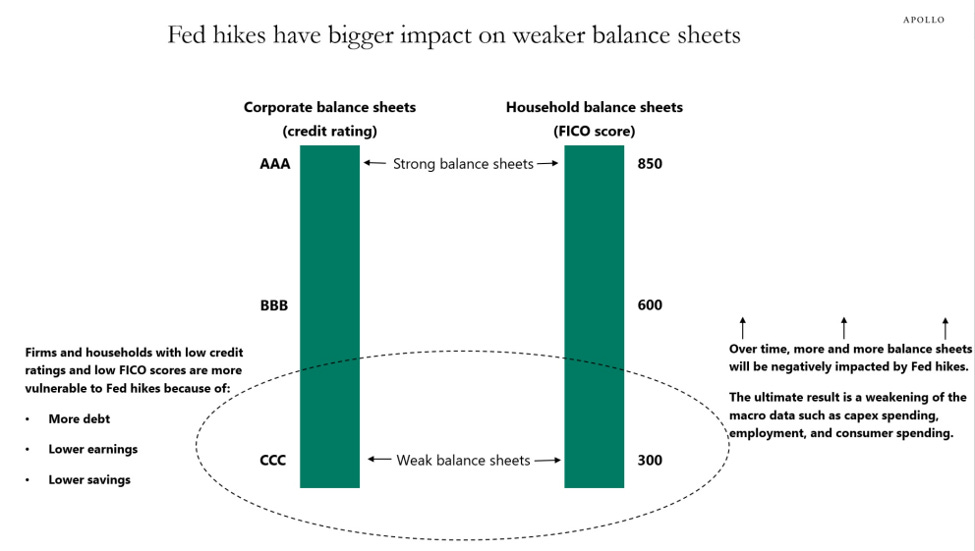
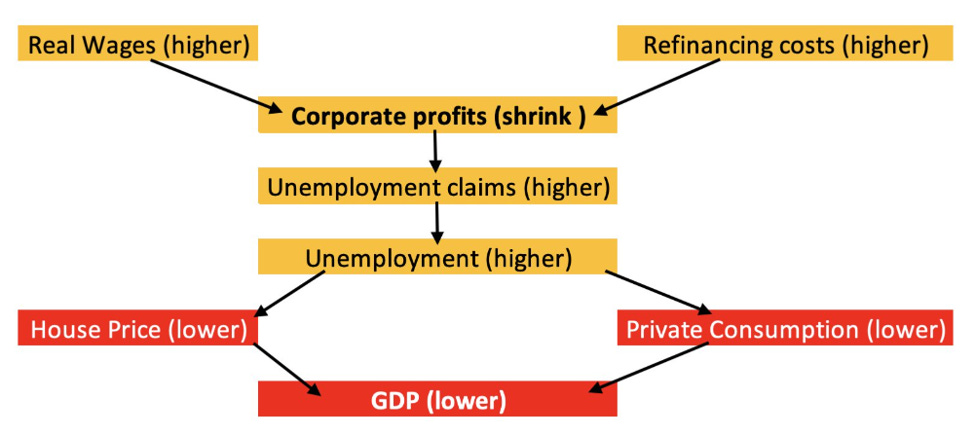
We were on the outlook for a schematic of the slow dispersion of increasing rates into the economy. Apollo has a good compact one.
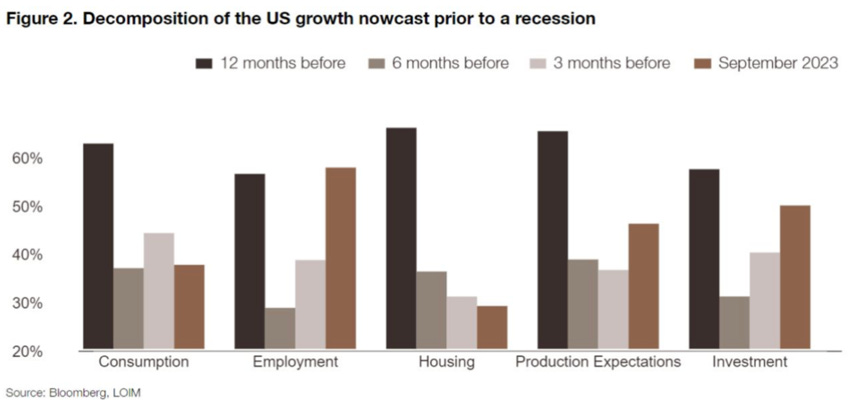
If one looks at where the various growth drivers currently are, compared to the beginning of previous recessions, one can see that the main outliers are employment (as you know we believe it is weaker than the likely to be massively revised numbers show), investment (thank you Inflation Reduction Act, other government programs and AI frenzy!) and production expectation.
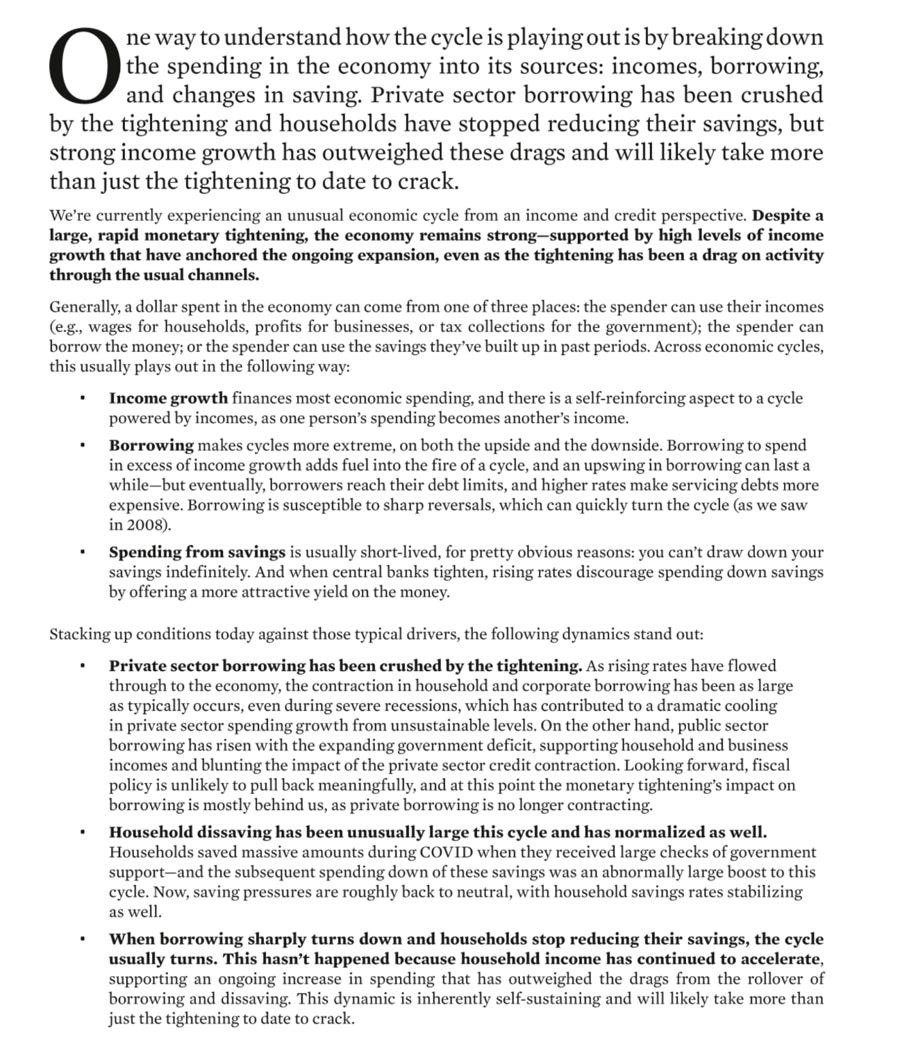
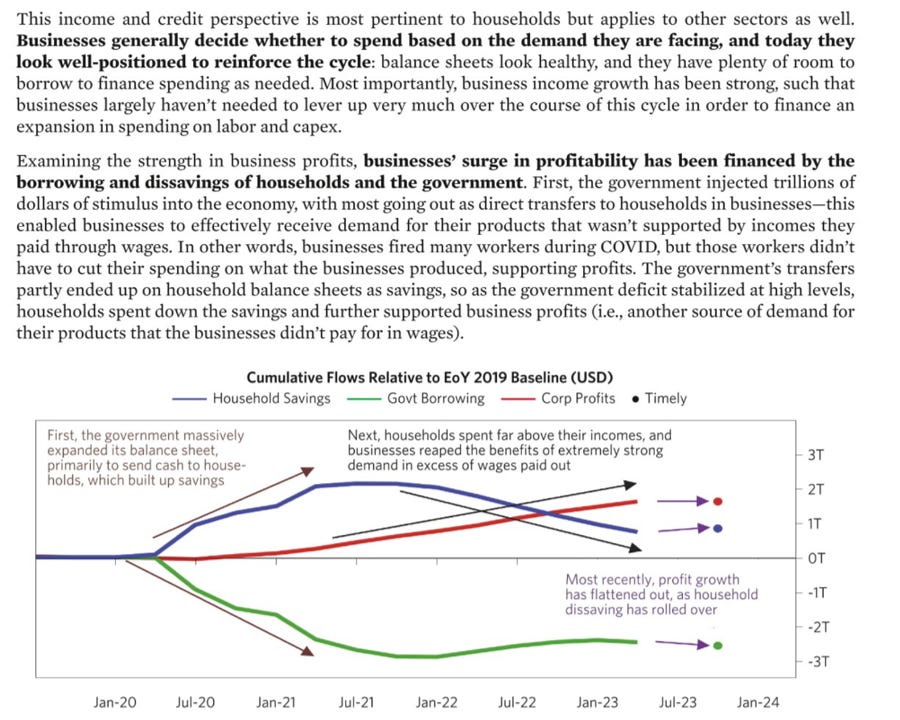
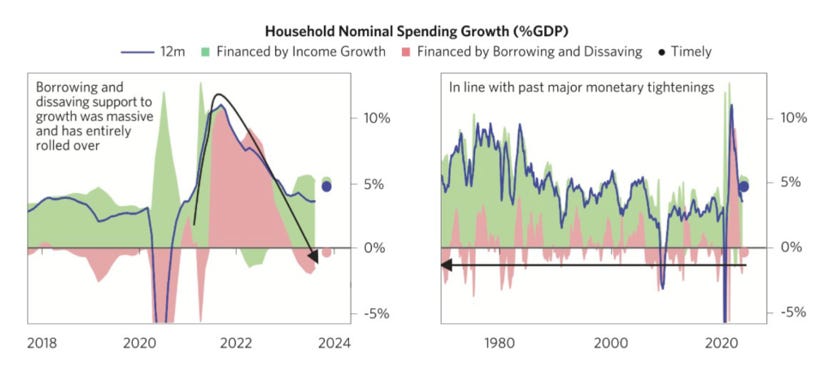
Bridgewater has also an excellent take on why the economy has been more resilient than perhaps expected, aside from the dichotomy we have written so much about, between those initially profiting from raising rates and the others.
Income growth has been the big contributor to the increase of household nominal spending. This as we showed in previous editions, came from relative employment strength, short duration assets, rising interest incomes (vs long duration liabilities) and stable interest expense (for the more affluent).
Macro – Headwinds
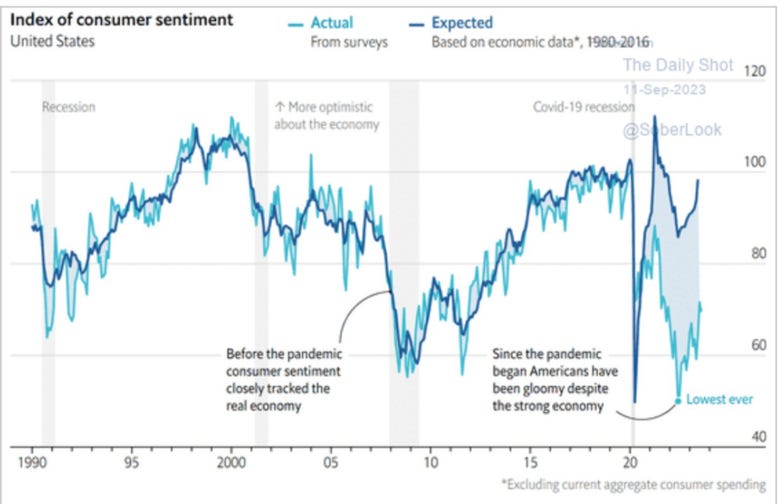
The tailwinds mentioned above are now in the rearview mirror. We can already see that consumer sentiment is much lower than what it should be according to the macro data. This is most probably due to the dichotomy we have referred to at numerous time, between the one taking advantage of rising interest rates and the others……..
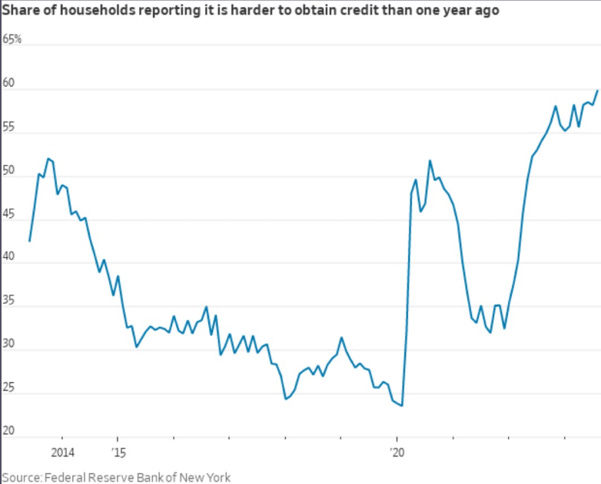
… for whom it is increasingly difficult to live beyond their limited means because of the unwillingness of lenders to accommodate them and the very high interest rate they would have to pay.
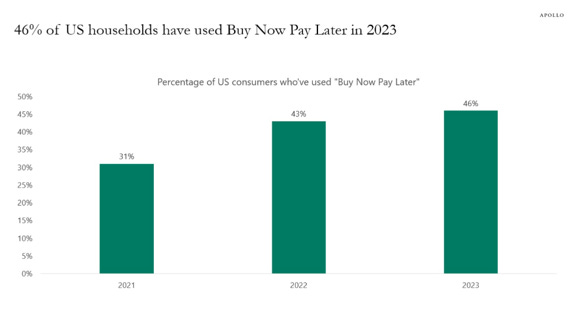
‘Buy now pay later’ growth has been rapid but even this won’t be as supportive going forward.
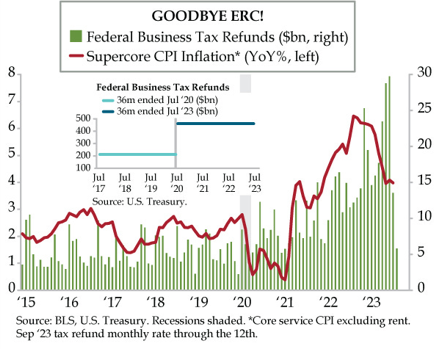
Employment Retention Credits have also peaked now (they reached more than 15% of total corporate profits if annualized during a couple of months recently).
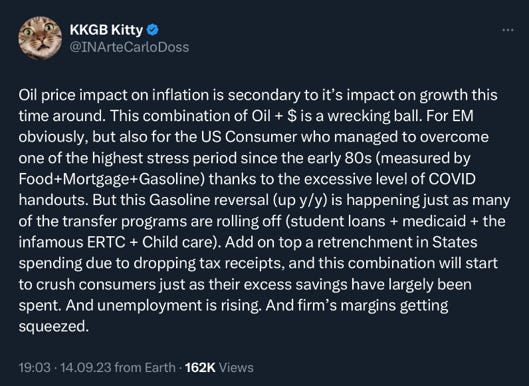
For the best take on recent energy prices increase we refer to @INArteCarloDoss
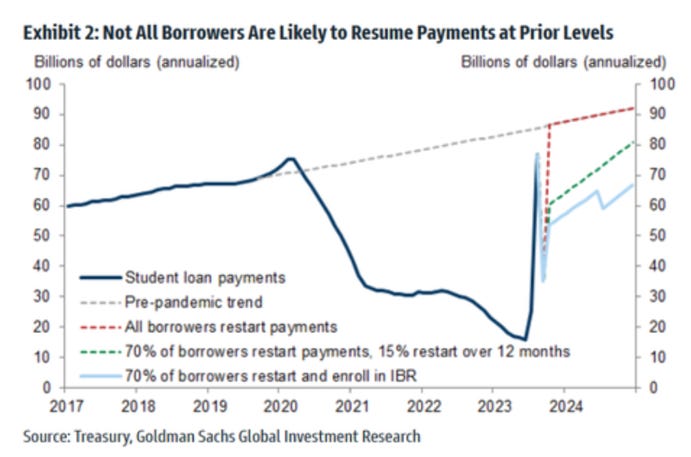
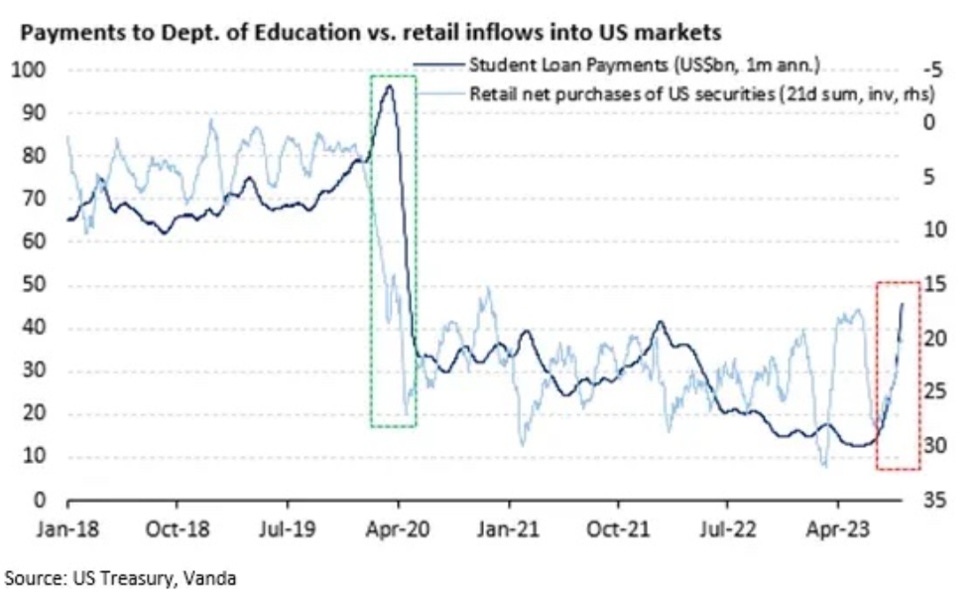
There is also the end of the moratorium on student loan payments since the end of August.
And while we know full well that correlation is not causation, beside supporting higher consumption, it probably also encouraged speculation because as we also know, savings are for oldies so let’s YOLO!
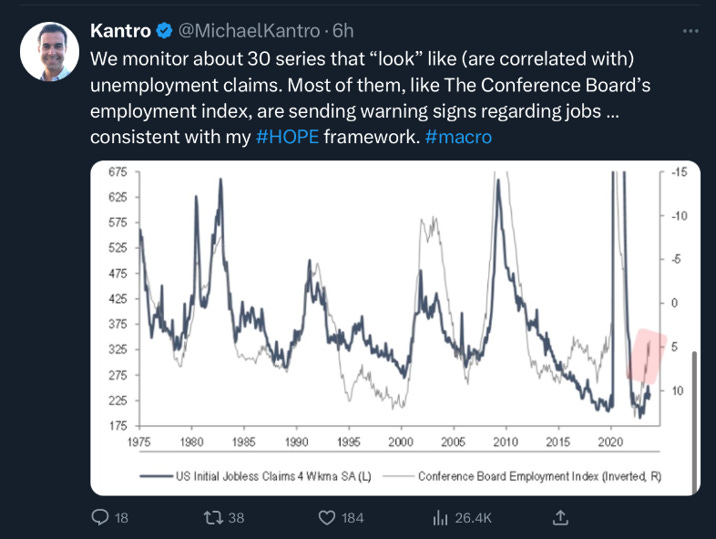
We won’t go over our views on the job market again, beside this tweet from Michael Kantrowitz.
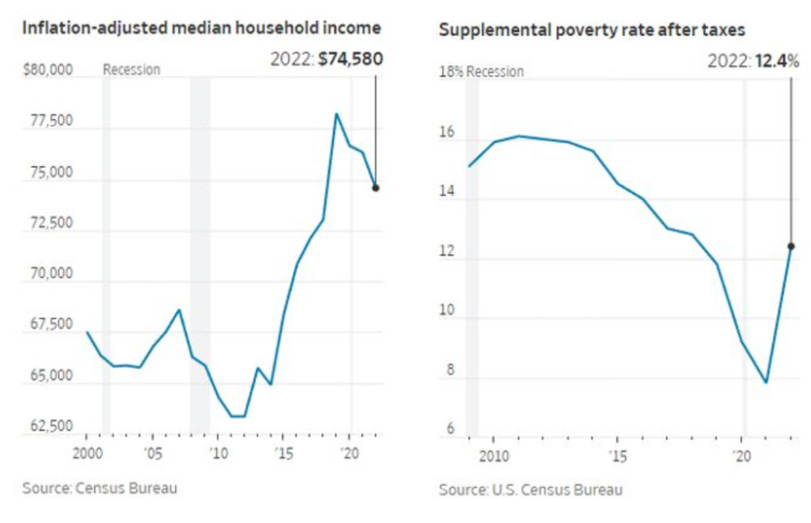
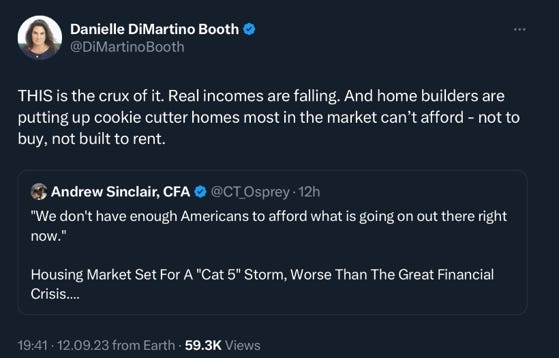
Weakening job markets, when combined with falling real income, are not a recipe for booming consumption.
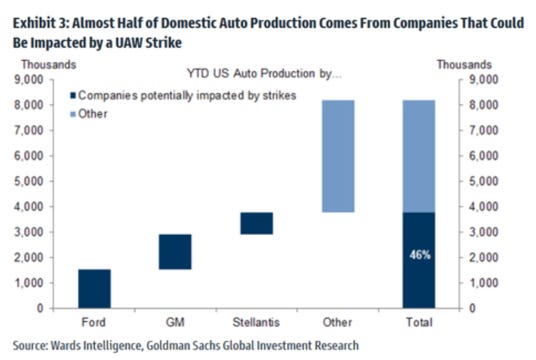
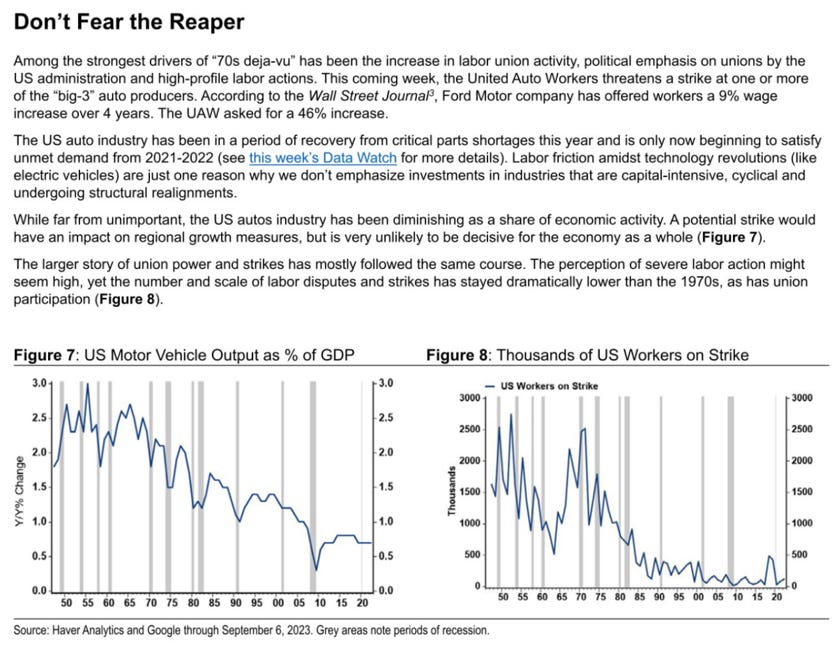
Falling real incomes and the success of some mediatized contract negotiation (UPS, Delta,…) are encouraging unions to fight harder and workers to join them. The next big confrontation is taking place in Detroit…
When we read the following we feel complacency as it is the psychological effect on the entire workforce that will really matter, not the inuendo of this particular deal.
Macro – Lags
Really matter because…
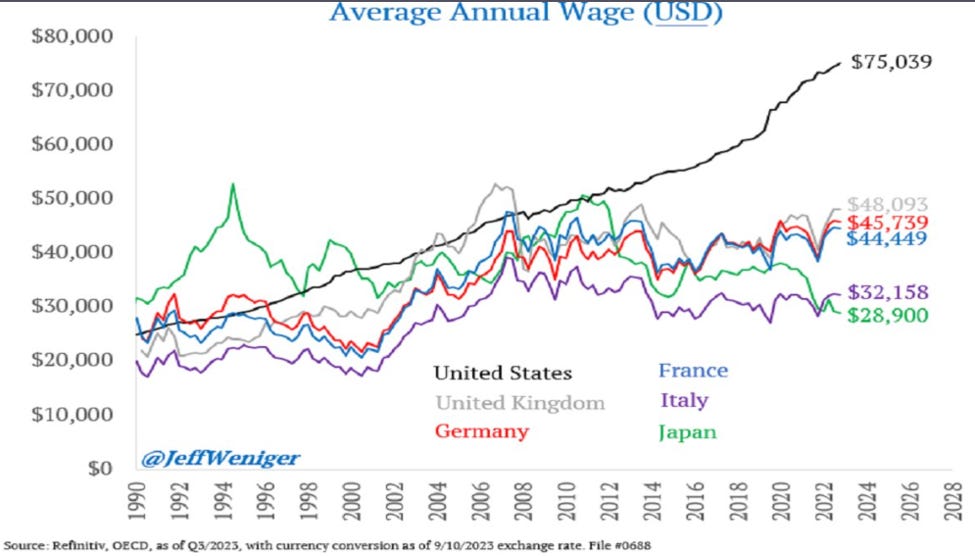
As an aparté, were you aware of this? Don’t be surprised to see a booming Japanese labor market during the next expansion.
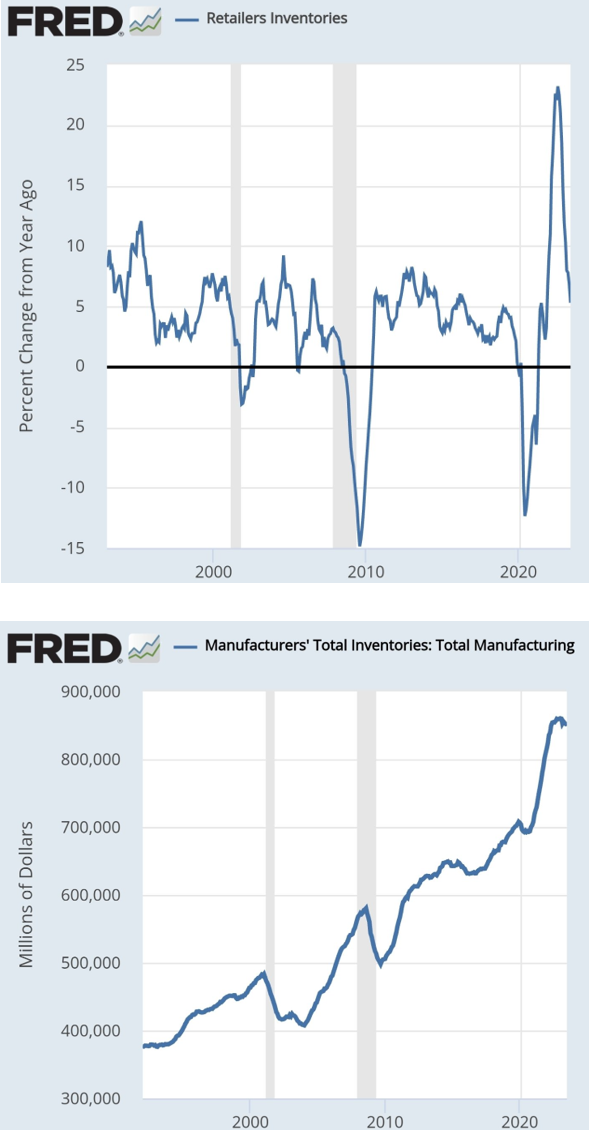
Note too that inventories are also key to the recession calls, our guess is that levels are sitting too high almost everywhere…
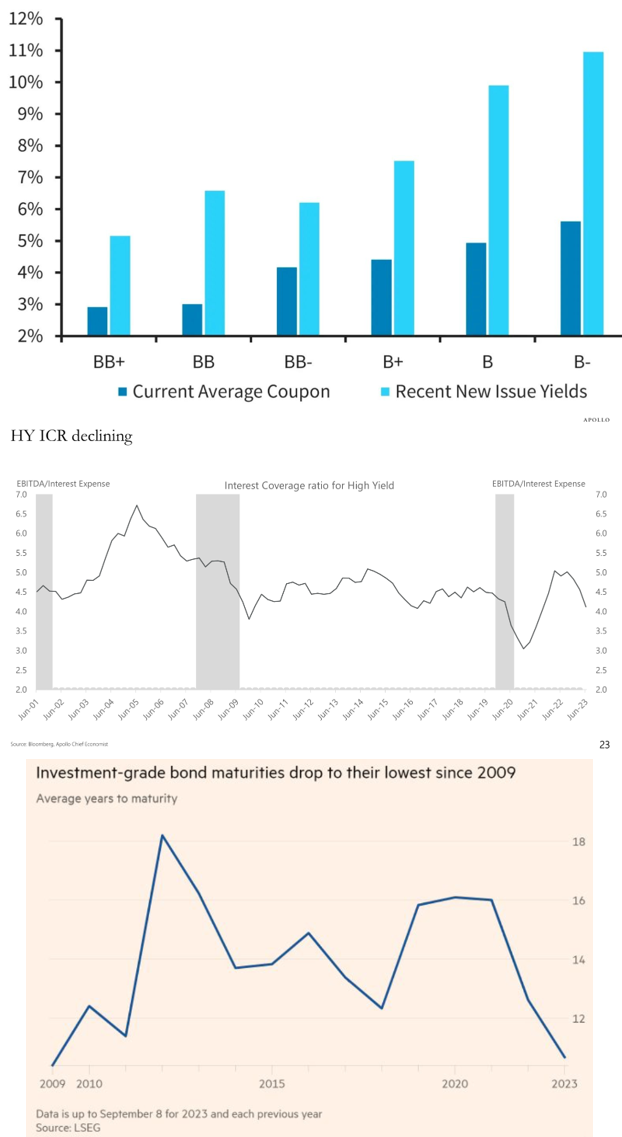
All of this is occurring while refinancing is getting more and more expensive, the coverage ratio is deteriorating and duration declining.
Macro – Housing
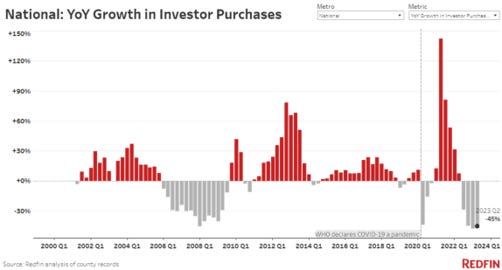
We are on record saying that we are not as reassured by the state of the housing markets as many others. Investors using leverage are finding it very hard to participate.
There is also the potential risk of a grossly undercounted inventory of house (and inventory in the making). If anyone has confirming or infirming info on this, we would love to hear from you.
Related to the student loan non-payments used to speculate on stocks before, why not on housing too!
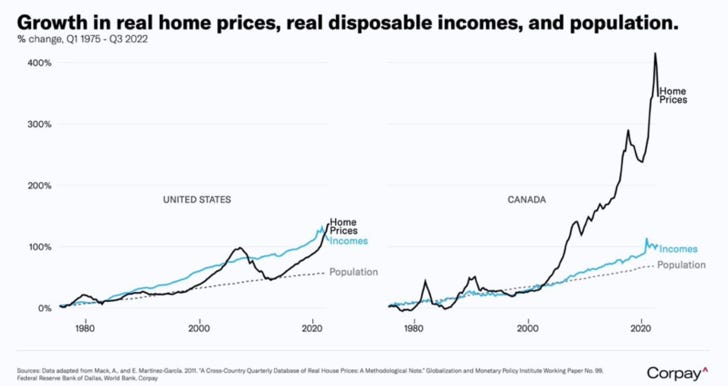
Once more a graph on the Canadian housing market. A graph I am sure will end up in many financial history book…
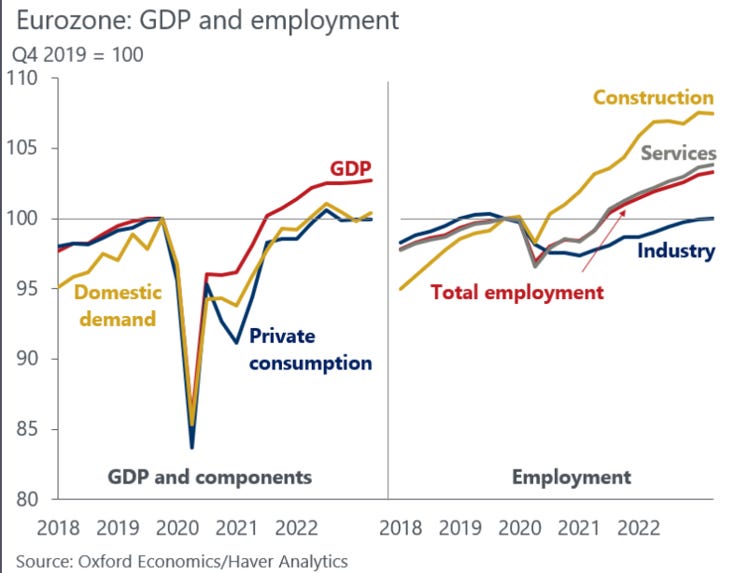
Did Europe also need this? Having lived many years in Sweden, the influence on the housing boom (frenzy) on the whole economy was palpable. How will Europe dig itself out of the hole it has put itself in?
Macro – Central Banks
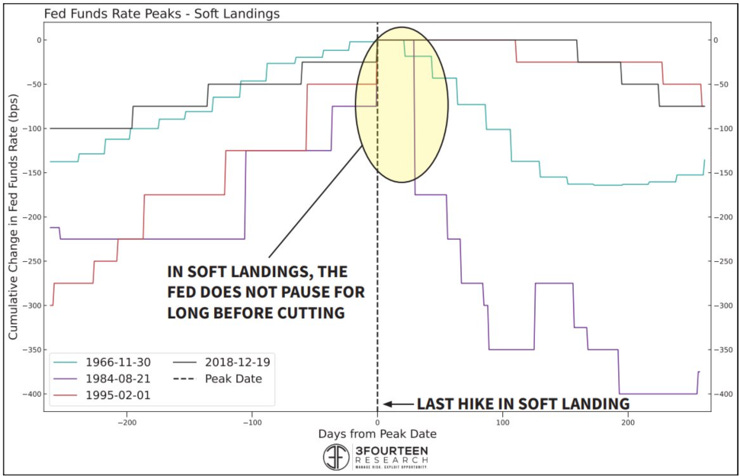
Historically, soft landings have occurred when the Fed has been quick to lower rates. “Higher for longer” won’t do it.
What better to transition with to the market sentiment section……
Market – Sentiment
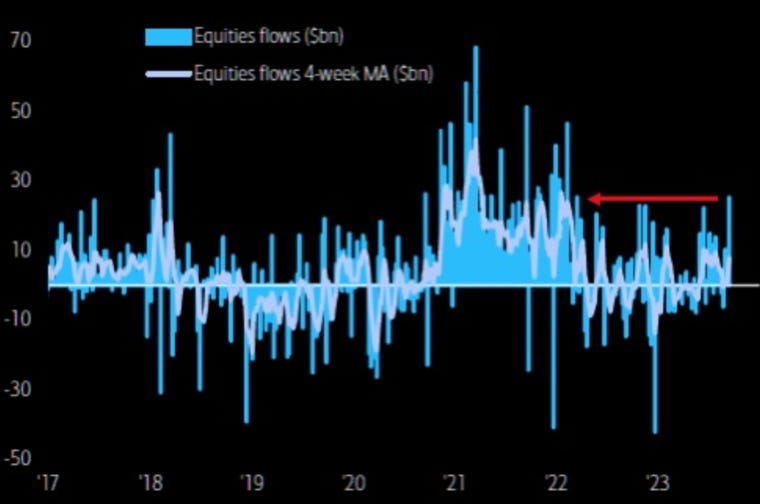
Four week moving average inflows into equities funds reached their highest level since early 2022 last week. Buying the dip?
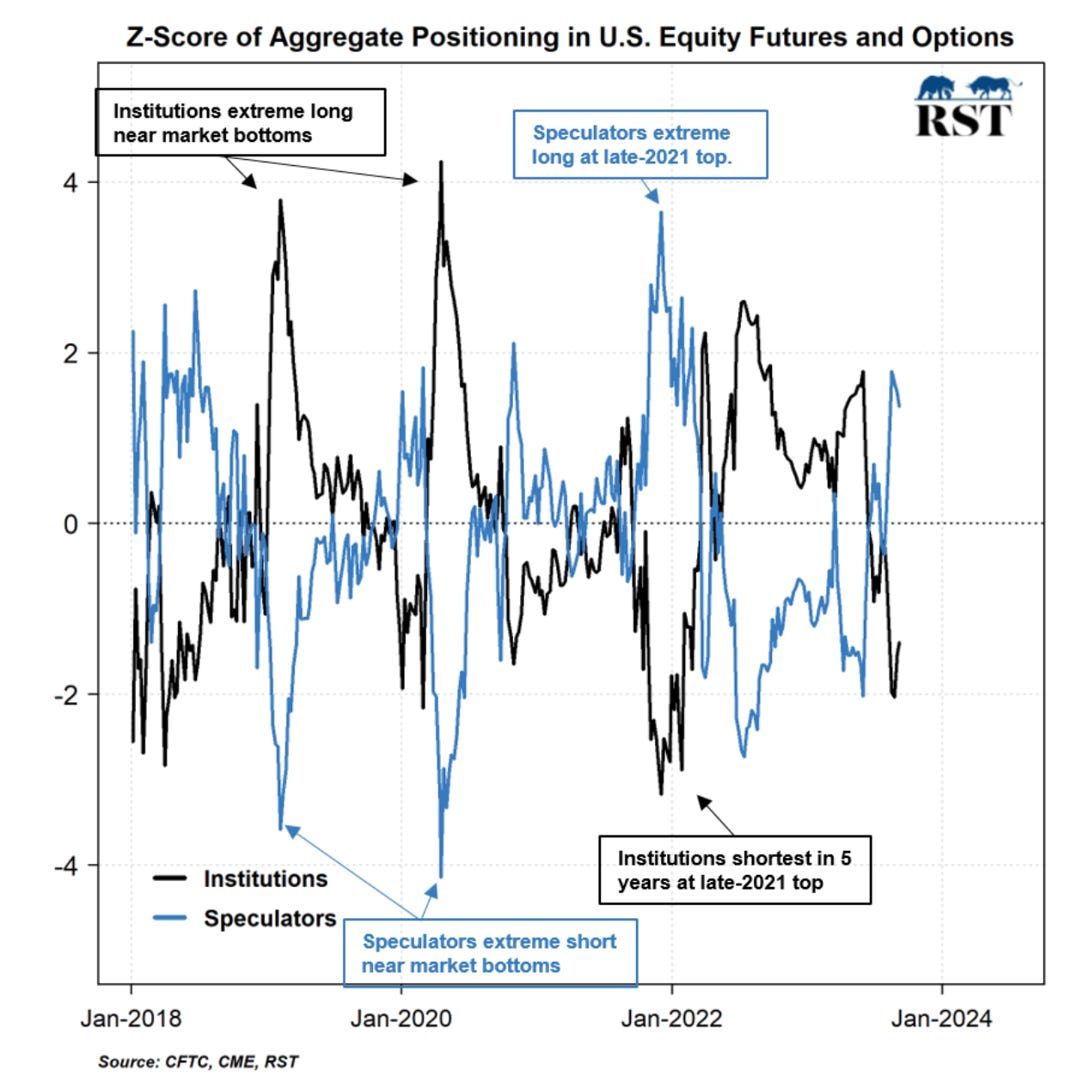
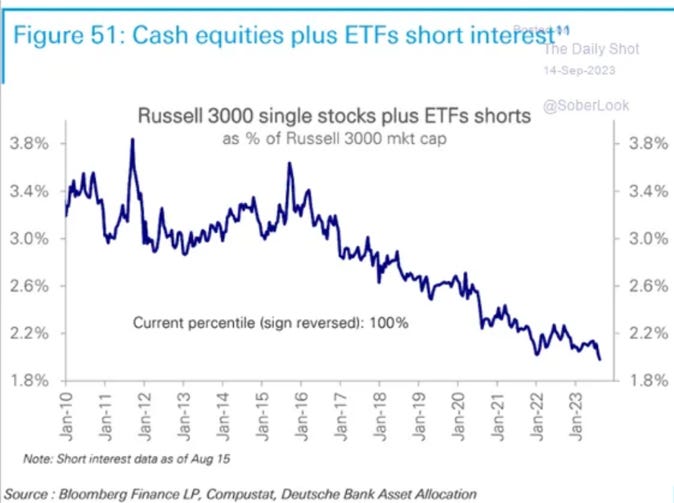
At the same time HFs have been busy selling.
When the behavior of retail/RIA and hedge funds diverges, you are usually better off following HFs.
Same here…
Really?
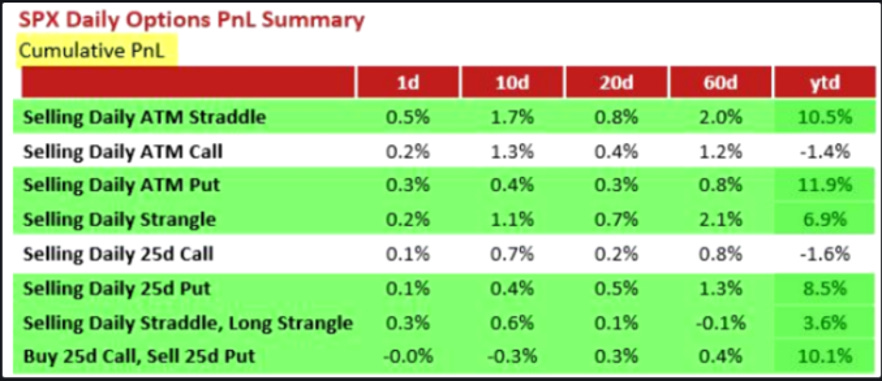
Especially when shorting volatility has been so successful… While the timing is uncertain, there is an accident waiting to happen. Don’t be a hero, please!
Market – Liquidity
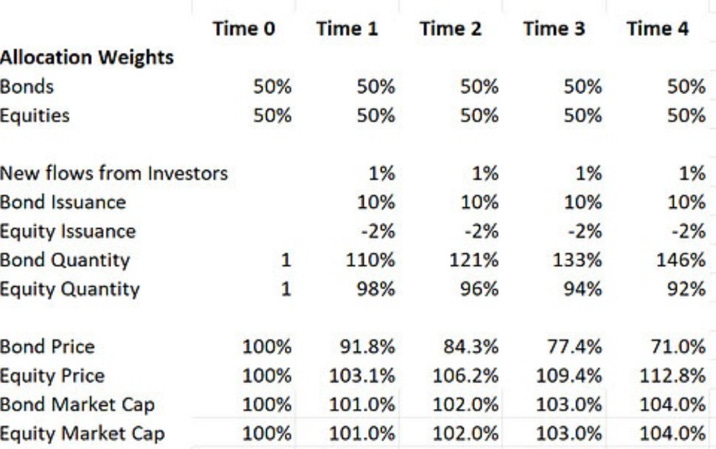
Mike Green has written for years about the metastatic influence that passive, value agnostic strategies have on the market. He just published this tables which shows the influence of issuance on relative demand for equities and bonds.
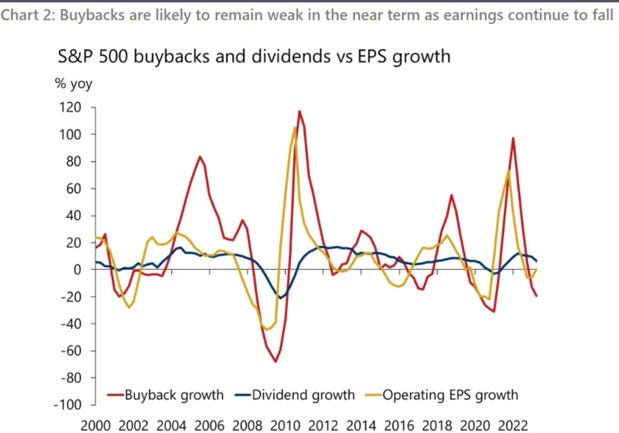
We said that buybacks (unfortunately also often agnostic to valuation) which have been THE main drivers of the US equity bull run since 2009 would decelerate. This looks like is happening as we write…
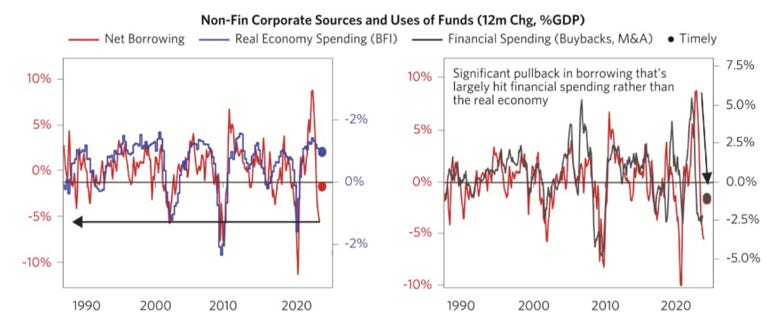
Bridgewater is also highlighting it. We have long argued that once rates fall below a certain threshold, it is not productive investment which is done but Central Banks simply create an incentive to raise debt to reshuffle existing capital. CB’s basically encourage the creation of debt unbacked by new productive capital. We wrote an article on the subject in… 2013… https://www.linkedin.com/pulse/central-bank-enablers-global-instability-damien-cleusix/
Market – Intermarkets
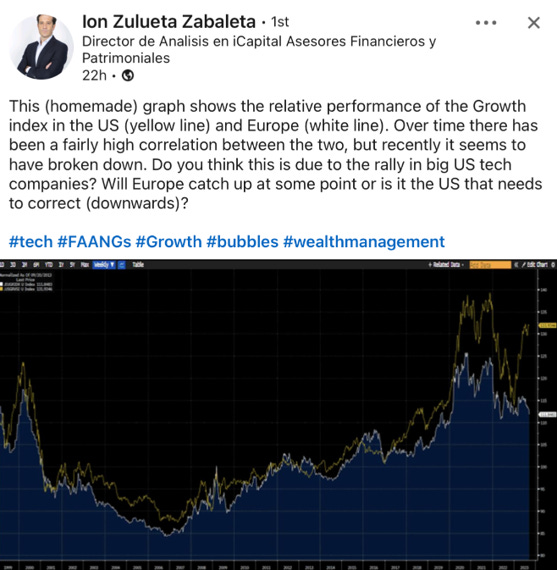
Ion Zulueta Zabaleta noticed the large divergence between US and European growth companies. Probably due to several factors not all due to speculation (higher margin, better balance sheet,…) and you’d guess way, way, more valuation agnostic demand....
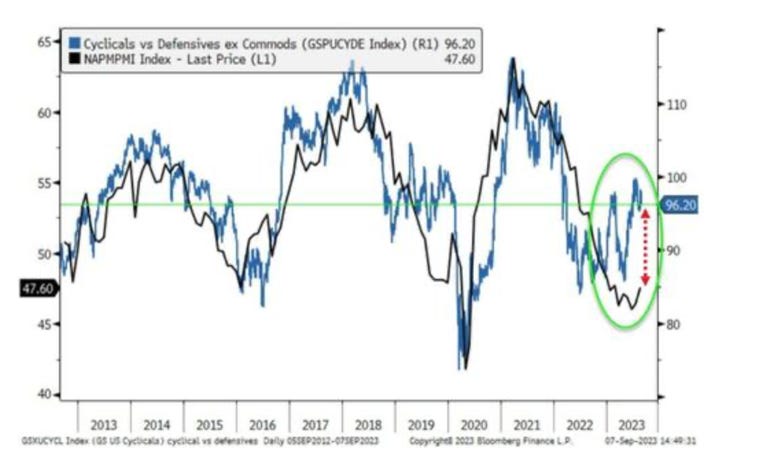
‘Cyclicals’ are outperforming ‘defensive’ while the ISM survey would suggest underperformance. When there is a divergence, the Cyclicals/Defensive ex commodities ratio usually snaps back to the ISM survey implied level.
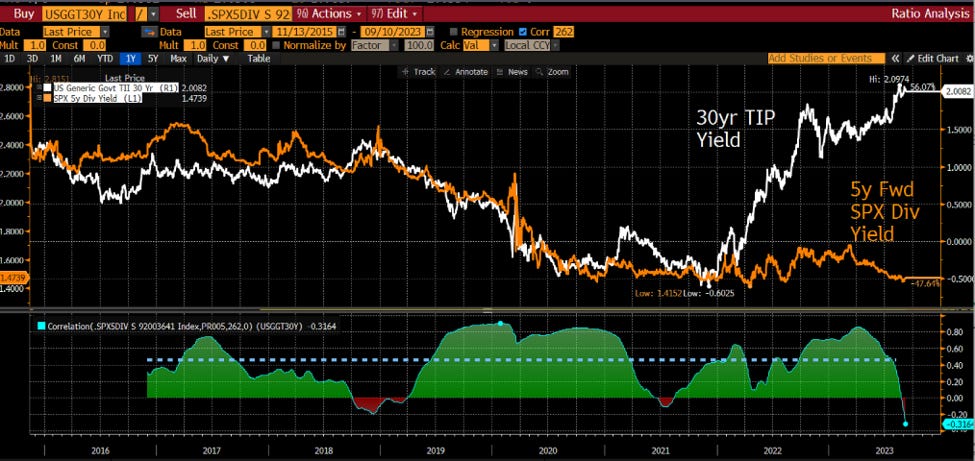
Mike Green with another great chart showing the divergence of 5 years forward S&P500 dividend yield and 30 years TIP yield. Higher for longer with falling inflation implies something equity bull are not going to like.
Market – Breadth
When it comes to markets internal analysis, we warmly recommend everyone to read J.Hussman historical comments. Everyone should incorporate the study of uniformity in their toolbox.
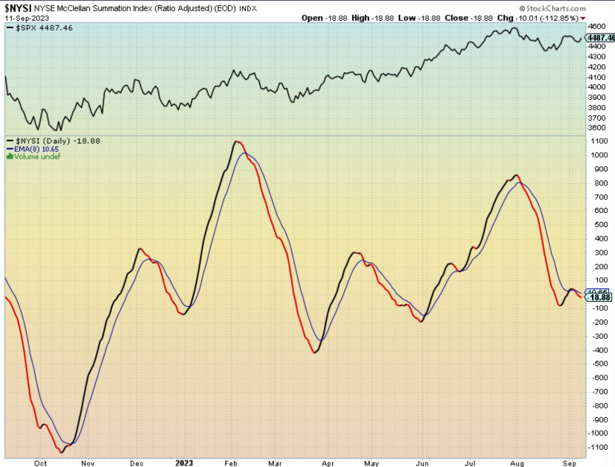
The NYSE McClellan ratio adjusted summation index is weak and has just stated to curl down while in a downtrend.
Market – Valuation
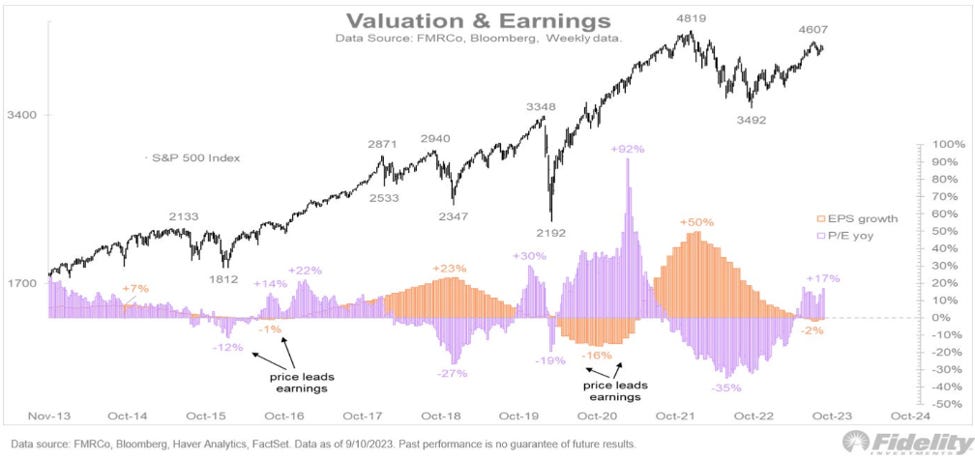
The US market ‘up move’ this year has mostly been the result of PE ratio expansion. The only hope for the bulls now is EPS growth…
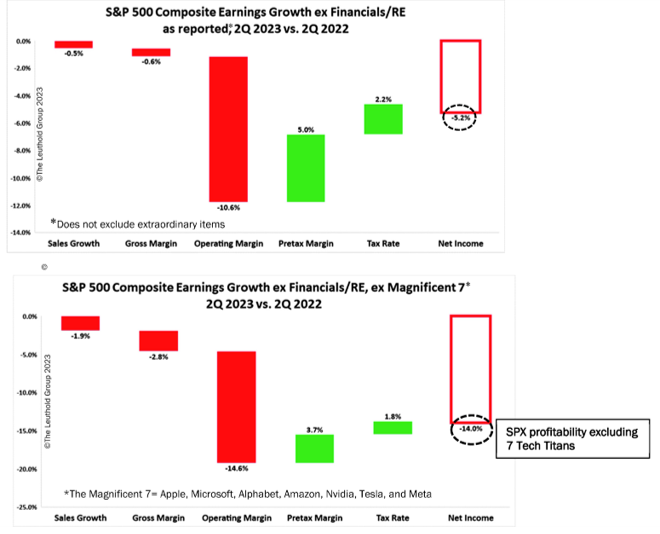
… will need help from more than 7 stocks…
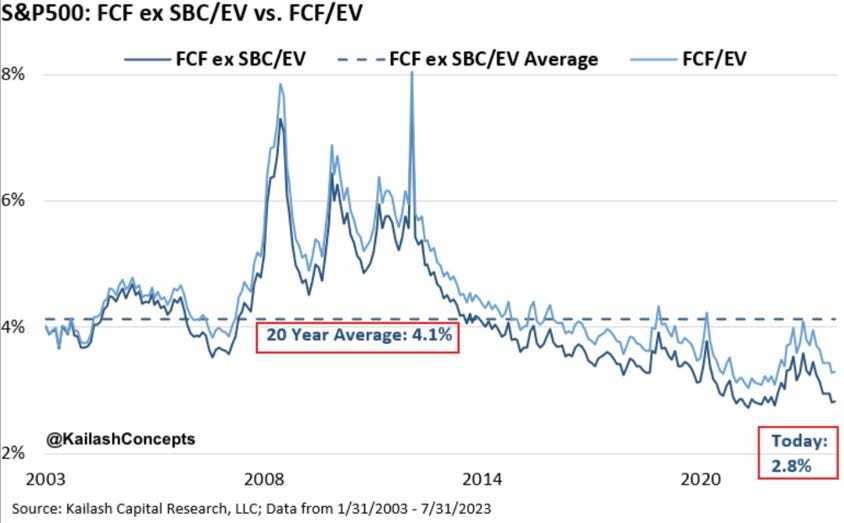
How many analysts are adjusting FCF for SBC?
Market – Fixed Income
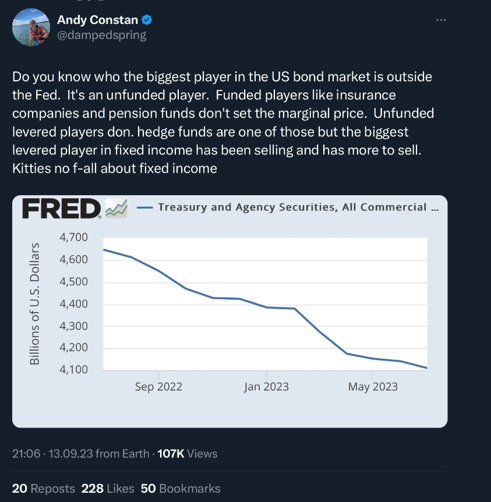
The debate on the cause of the recent pick up in yields and where they are heading to is raging now. This week we show Andy Constan’s view that unfunded players (the answer to his question is banks) are an important drivers.
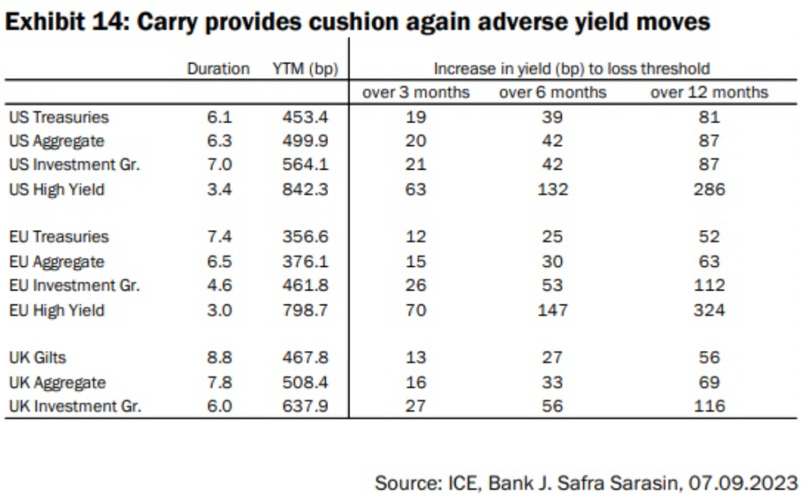
Anyhow the risk-reward, at least for US government bonds, seems pretty compelling given the carry cushion.
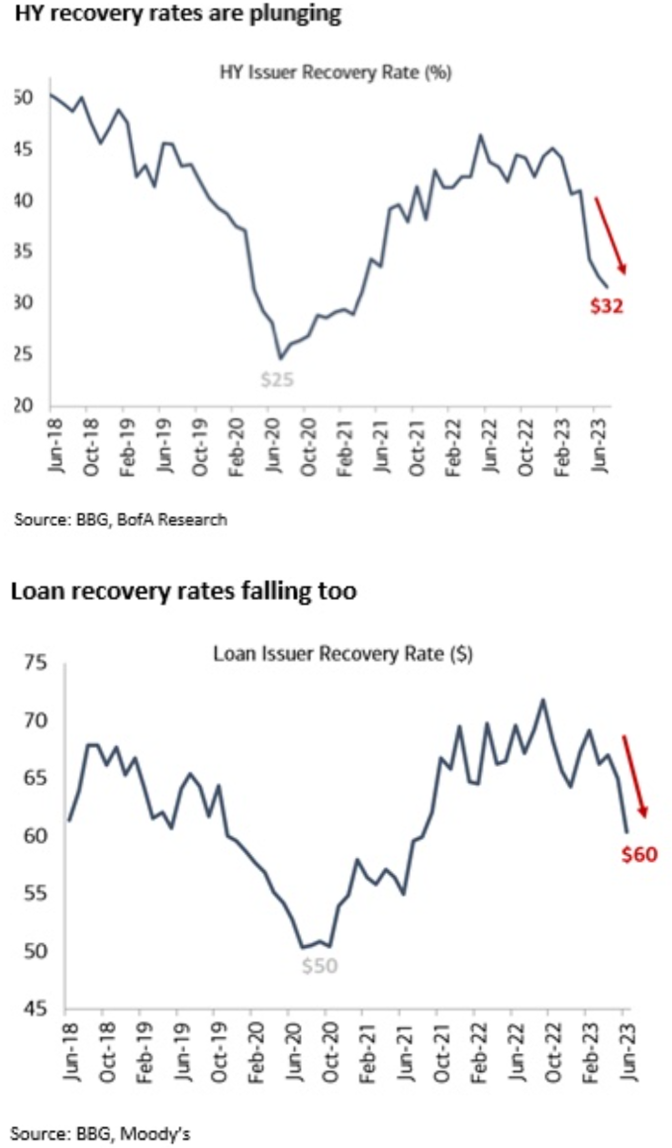
We are not yet ready to jump on high yields and loans…
Market – Commodities
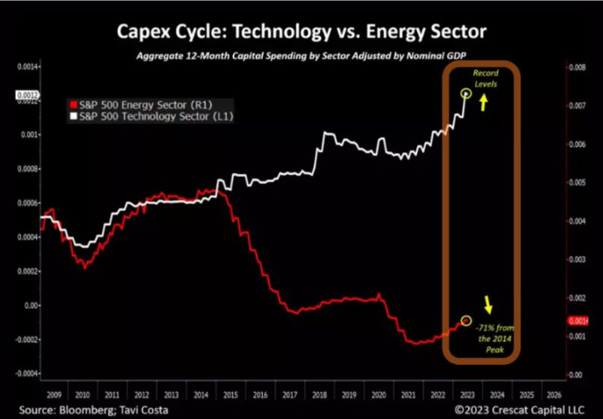
We documented the insufficient capex going into commodities due to the rise of ESG related constraints and reputational risk.
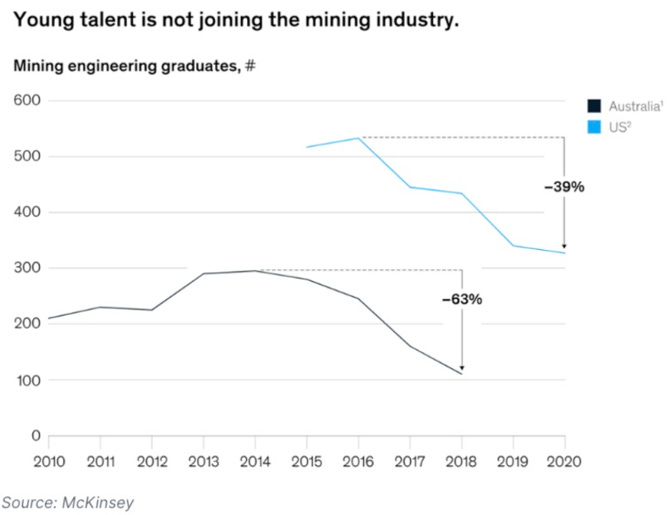
This is also impacting students’ career choices…
No capex, no engineers… Consequences?
Market – Asset Allocation
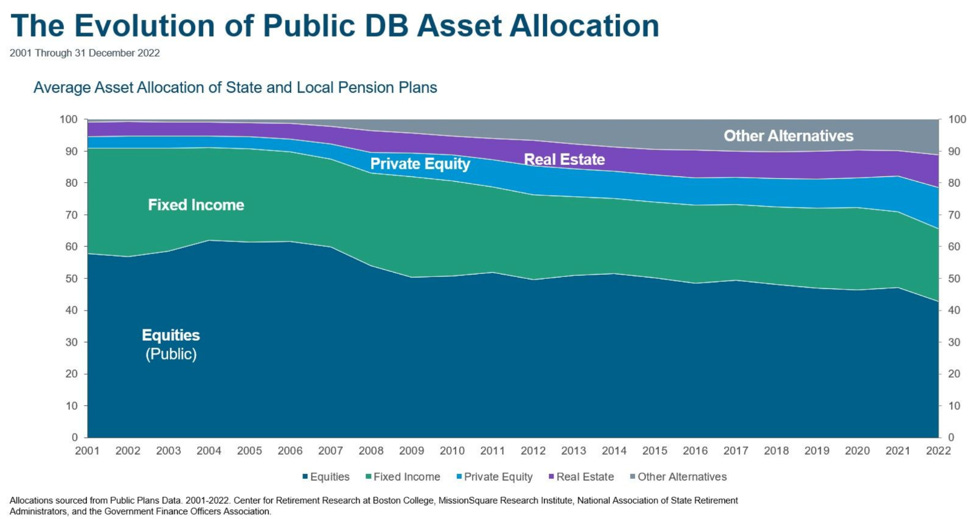
You know by now that we have our reservations on Private Equity…
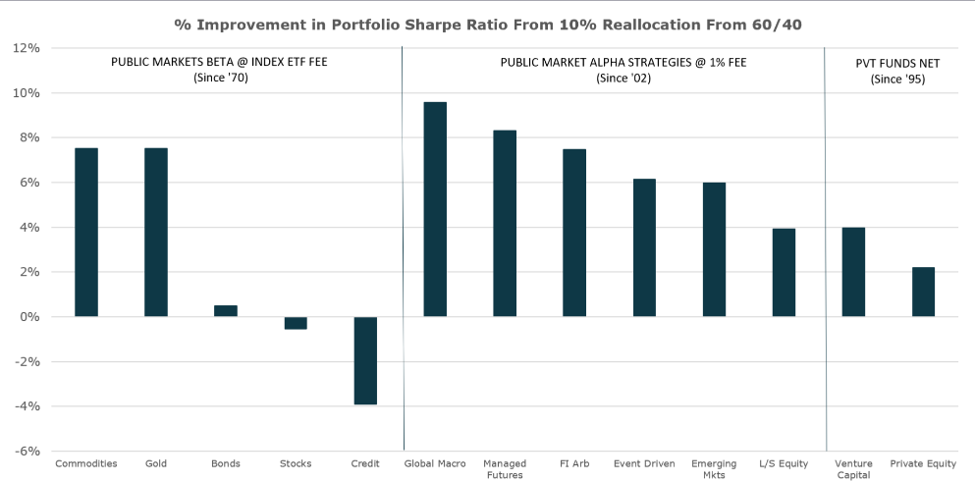
…even if we take PE performance at face value, reallocating 10% of the 60/40 portfolio to PE produces one of the lowest Sharpe Ratio improvement…..
Others
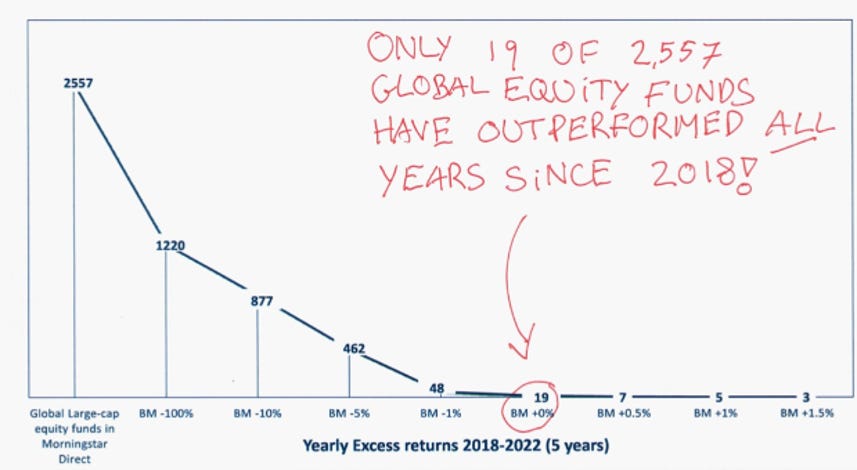
It is hard to beat the markets year in and year out. Most of the best managers have had several stretches of underperformance.





This is very very good. Thank you